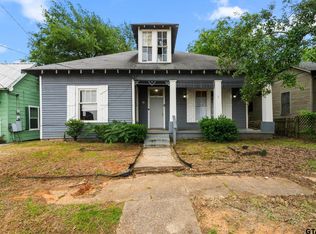
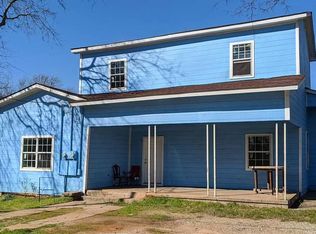
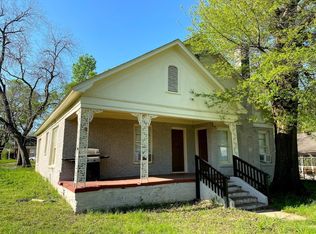
Perfectly located just minutes from downtown and close to shopping, dining, and everyday essentials, this income-generating duplex is a smart addition to any investment portfolio. One unit offers 3 bedrooms and 1 bathroom, while the other features 2 bedrooms and 1 bathroom—ideal for maximizing rental income and attracting a variety of tenants. With a total gross rent of $1,880 per month, this property offers steady cash flow and long-term potential. Whether you're looking to house hack or expand your rental holdings, this property is move-in ready for tenants and positioned for strong returns. Schedule a tour today and start earning from day one!
For sale
Price cut: $10K (1/2)
$99,500
316 E Rosedale St, Tyler, TX 75702
5beds
2baths
2,420sqft
Est.:
Duplex
Built in 1940
-- sqft lot
$127,700 Zestimate®
$41/sqft
$-- HOA
What's special
- 289 days |
- 461 |
- 40 |
Zillow last checked: 8 hours ago
Listing updated: February 11, 2026 at 07:40am
Listed by:
Tyler Martin 903-258-0170,
The Brian Chinn Team, eXp Realty,
Brian Chinn 903-480-9988
Source: GTARMLS,MLS#: 25006864
Tour with a local agent
Facts & features
Interior
Bedrooms & bathrooms
- Bedrooms: 5
- Bathrooms: 2
Heating
- Wall Furnace
Cooling
- Window Unit(s)
Features
- Has fireplace: No
- Fireplace features: None
Interior area
- Total structure area: 2,420
- Total interior livable area: 2,420 sqft
Property
Parking
- Parking features: 1 Or More Per Unit
Details
- Parcel number: 150000021900015000
- Zoning description: Planned Unit Residential
- Special conditions: Other/See Remarks
Construction
Type & style
- Home type: MultiFamily
- Property subtype: Duplex
Materials
- Siding
- Foundation: Pillar/Post/Pier
Condition
- Year built: 1940
Community & HOA
Community
- Subdivision: VALENTINE HAMVASSEY
Location
- Region: Tyler
Financial & listing details
- Price per square foot: $41/sqft
- Tax assessed value: $222,948
- Annual tax amount: $2,855
- Date on market: 5/6/2025
- Tenant pays: Other/See Remarks
Estimated market value
$127,700
$120,000 - $135,000
$1,229/mo
Price history
Price history
| Date | Event | Price |
|---|---|---|
| 2/11/2026 | Listed for sale | $99,500$41/sqft |
Source: | ||
| 1/16/2026 | Pending sale | $99,500$41/sqft |
Source: | ||
| 1/2/2026 | Price change | $99,500-9.1%$41/sqft |
Source: | ||
| 12/10/2025 | Price change | $109,500-4.8%$45/sqft |
Source: | ||
| 11/17/2025 | Listed for sale | $115,000$48/sqft |
Source: | ||
| 11/7/2025 | Listing removed | $115,000$48/sqft |
Source: GTARMLS #25006864 Report a problem | ||
| 11/4/2025 | Price change | $115,000-6.4%$48/sqft |
Source: | ||
| 10/16/2025 | Price change | $122,900-0.8%$51/sqft |
Source: | ||
| 9/23/2025 | Price change | $123,900-0.8%$51/sqft |
Source: | ||
| 9/12/2025 | Price change | $124,900-0.8%$52/sqft |
Source: | ||
| 9/9/2025 | Price change | $125,900-0.8%$52/sqft |
Source: | ||
| 9/2/2025 | Price change | $126,900-0.8%$52/sqft |
Source: | ||
| 8/22/2025 | Price change | $127,900-0.8%$53/sqft |
Source: | ||
| 8/18/2025 | Price change | $128,900-0.8%$53/sqft |
Source: | ||
| 7/17/2025 | Price change | $129,900-3.8%$54/sqft |
Source: | ||
| 6/2/2025 | Price change | $135,000-9.4%$56/sqft |
Source: | ||
| 5/6/2025 | Listed for sale | $149,000+7.2%$62/sqft |
Source: | ||
| 10/29/2024 | Listing removed | $139,000$57/sqft |
Source: | ||
| 10/2/2024 | Pending sale | $139,000$57/sqft |
Source: | ||
| 9/4/2024 | Listing removed | $139,000$57/sqft |
Source: | ||
| 8/22/2024 | Pending sale | $139,000$57/sqft |
Source: | ||
| 8/15/2024 | Listed for sale | $139,000-18.2%$57/sqft |
Source: | ||
| 8/14/2024 | Listing removed | -- |
Source: | ||
| 6/14/2024 | Listed for sale | $169,900$70/sqft |
Source: | ||
| 6/4/2021 | Sold | -- |
Source: | ||
Public tax history
Public tax history
| Year | Property taxes | Tax assessment |
|---|---|---|
| 2024 | $2,786 +17.1% | $222,948 +63.3% |
| 2023 | $2,379 +14.6% | $136,492 +28.8% |
| 2022 | $2,076 +28.2% | $105,981 +37% |
| 2021 | $1,619 +39.1% | $77,336 +39.4% |
| 2020 | $1,164 -0.5% | $55,481 +1.4% |
| 2019 | $1,170 +2.3% | $54,694 +4.6% |
| 2018 | $1,144 +0.5% | $52,307 |
| 2017 | $1,138 +4.1% | $52,307 +2.2% |
| 2016 | $1,093 +33.9% | $51,199 +3.3% |
| 2015 | $816 | $49,580 |
| 2014 | $816 +3.5% | -- |
| 2013 | $789 -2% | -- |
| 2012 | $805 -2.6% | -- |
| 2011 | $827 | -- |
| 2010 | -- | $50,140 -3.2% |
| 2009 | -- | $51,815 +1.6% |
| 2008 | -- | $51,000 |
| 2007 | -- | $51,000 |
| 2006 | -- | $51,000 +11.6% |
| 2005 | -- | $45,700 +210.9% |
| 2004 | -- | $14,700 -38.5% |
| 2003 | -- | $23,900 +8.6% |
| 2002 | -- | $22,000 +6.8% |
| 2001 | -- | $20,600 +22.6% |
| 2000 | -- | $16,800 |
Find assessor info on the county website
BuyAbility℠ payment
Est. payment
$604/mo
Principal & interest
$513
Property taxes
$91
Climate risks
Neighborhood: 75702
Nearby schools
GreatSchools rating
- 3/10Douglas Elementary SchoolGrades: PK-5Distance: 0.4 mi
- 6/10Moore Mst Magnet SchoolGrades: 6-8Distance: 2.2 mi
- 4/10Tyler High SchoolGrades: 9-12Distance: 2.8 mi
Schools provided by the listing agent
- Elementary: Douglas
- Middle: Boulter
- High: Tyler High
Source: GTARMLS. This data may not be complete. We recommend contacting the local school district to confirm school assignments for this home.
Local experts in 75702