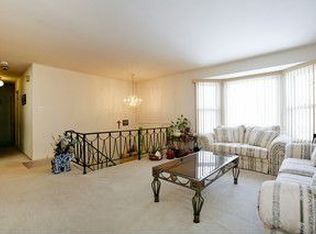
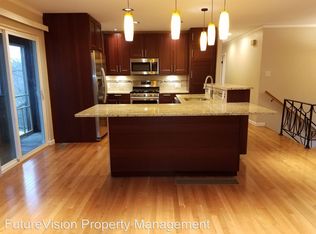
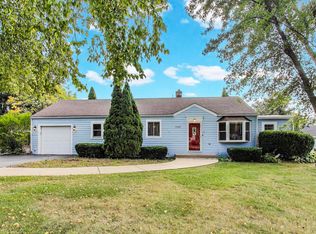
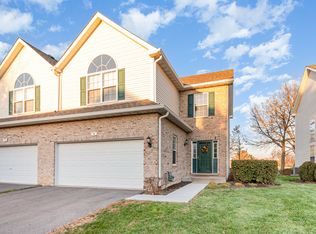
$368,800
4 bd|2 ba|2k sqft
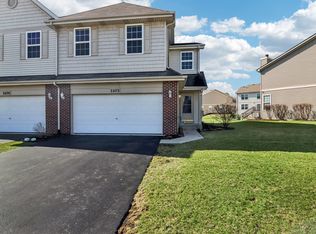
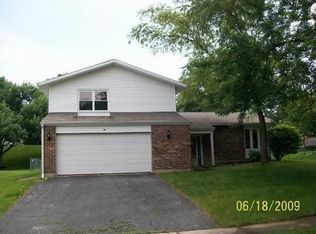
312 Bedford Rd, Bolingbrook, IL 60440
Off Market
Zillow last checked: 7 hours ago
Listing updated: 16 hours ago
Michell Lukasik 630-743-3872,
RE/MAX Professionals,
Edward Lukasik Jr 630-768-5175,
RE/MAX Professionals
Not available
Estimated sales range
Not available
Not available
| Date | Event | Price |
|---|---|---|
| 3/18/2026 | Listed for sale | $349,900-3.3%$199/sqft |
Source: | ||
| 1/23/2026 | Listing removed | $361,900$206/sqft |
Source: | ||
| 1/15/2026 | Contingent | $361,900$206/sqft |
Source: | ||
| 12/2/2025 | Price change | $361,900-1.9%$206/sqft |
Source: | ||
| 9/9/2025 | Price change | $368,900-0.8%$210/sqft |
Source: | ||
| 8/13/2025 | Price change | $371,900-1.3%$212/sqft |
Source: | ||
| 7/23/2025 | Listed for sale | $376,900$215/sqft |
Source: | ||
| 7/23/2025 | Listing removed | $376,900$215/sqft |
Source: | ||
| 7/4/2025 | Contingent | $376,900$215/sqft |
Source: | ||
| 6/19/2025 | Price change | $376,900-0.8%$215/sqft |
Source: | ||
| 6/3/2025 | Listed for sale | $379,900$216/sqft |
Source: | ||
| 4/14/2025 | Contingent | $379,900$216/sqft |
Source: | ||
| 4/9/2025 | Price change | $379,900-1.3%$216/sqft |
Source: | ||
| 2/27/2025 | Listed for sale | $384,900$219/sqft |
Source: | ||
| Year | Property taxes | Tax assessment |
|---|---|---|
| 2023 | $6,386 +3.2% | $81,829 +11.2% |
| 2022 | $6,185 +6.3% | $73,573 +6.9% |
| 2021 | $5,818 +3.6% | $68,792 +3.4% |
| 2020 | $5,617 +4% | $66,530 +5% |
| 2019 | $5,402 +10% | $63,362 +8.7% |
| 2018 | $4,912 +5.9% | $58,295 +5.5% |
| 2017 | $4,638 +3.8% | $55,256 +5% |
| 2016 | $4,467 +4.6% | $52,600 +7.3% |
| 2015 | $4,273 | $49,000 +10.1% |
| 2014 | $4,273 +3% | $44,500 |
| 2013 | $4,146 +2.5% | $44,500 -5.1% |
| 2012 | $4,046 -4.4% | $46,900 -14.9% |
| 2011 | $4,234 -1.2% | $55,100 -10% |
| 2010 | $4,285 +2% | $61,200 -3% |
| 2009 | $4,202 -2% | $63,100 -6.9% |
| 2008 | $4,288 | $67,800 +4.1% |
| 2007 | -- | $65,100 +5% |
| 2006 | $4,014 +5.5% | $62,000 +9.9% |
| 2005 | $3,806 +10.4% | $56,400 +9.9% |
| 2004 | $3,449 +2.3% | $51,300 +4.7% |
| 2003 | $3,373 +9.5% | $49,000 +15% |
| 2002 | $3,079 +11.9% | $42,600 +15.8% |
| 2001 | $2,750 +5.1% | $36,800 |
| 2000 | $2,617 | $36,800 |
Find assessor info on the county website
Source: MRED as distributed by MLS GRID. This data may not be complete. We recommend contacting the local school district to confirm school assignments for this home.