$398,500
-- bd|2 ba|2k sqft
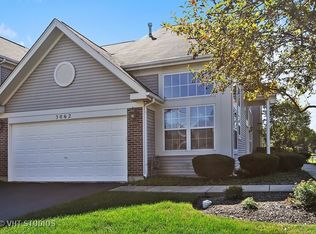
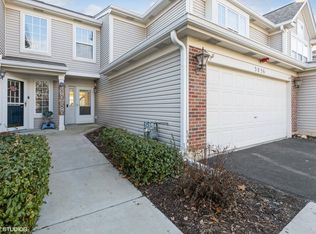
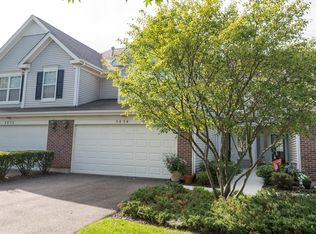
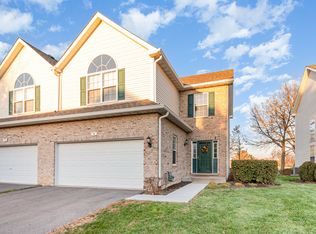
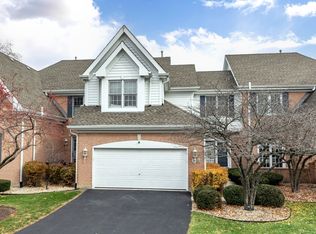
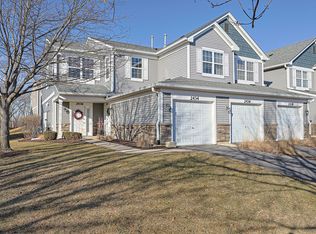
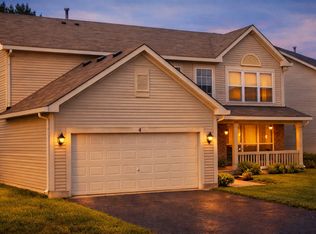
3058 Crystal Rock Rd, Naperville, IL 60564
Off Market
Likely to sell faster than
Zillow last checked: 8 hours ago
Listing updated: February 22, 2026 at 12:36pm
Ryan Widerberg (847)849-7748,
eXp Realty - Chicago North Ave
$371,800
$353,000 - $390,000
$2,807/mo
| Date | Event | Price |
|---|---|---|
| 2/12/2026 | Listed for sale | $380,000+72.7%$189/sqft |
Source: | ||
| 4/5/2024 | Listing removed | -- |
Source: Zillow Rentals Report a problem | ||
| 3/17/2024 | Listed for rent | $2,300+27.8%$1/sqft |
Source: Zillow Rentals Report a problem | ||
| 2/2/2018 | Listing removed | $1,800$1/sqft |
Source: Naperville #09815507 Report a problem | ||
| 12/12/2017 | Listed for rent | $1,800$1/sqft |
Source: Keller Williams Infinity #09815507 Report a problem | ||
| 3/16/2017 | Listing removed | $1,800$1/sqft |
Source: Keller Williams Infinity #09522086 Report a problem | ||
| 3/7/2017 | Listed for rent | $1,800+5.9%$1/sqft |
Source: Keller Williams Infinity #09522086 Report a problem | ||
| 8/16/2014 | Listing removed | $1,700$1/sqft |
Source: Keller Williams Realty Infinity #08687078 Report a problem | ||
| 7/31/2014 | Listed for rent | $1,700$1/sqft |
Source: Keller Williams Infinity #08687078 Report a problem | ||
| 2/25/2014 | Sold | $220,000-4.3%$109/sqft |
Source: | ||
| 1/27/2014 | Pending sale | $229,900$114/sqft |
Source: Baird & Warner Real Estate #08514141 Report a problem | ||
| 1/10/2014 | Listed for sale | $229,900+27.8%$114/sqft |
Source: Baird & Warner #08514141 Report a problem | ||
| 9/16/2011 | Sold | $179,900-25.5%$89/sqft |
Source: Public Record Report a problem | ||
| 3/9/2011 | Sold | $241,446$120/sqft |
Source: Public Record Report a problem | ||
| 10/5/2010 | Sold | $241,446+29.1%$120/sqft |
Source: Public Record Report a problem | ||
| 5/11/2000 | Sold | $187,000$93/sqft |
Source: Public Record Report a problem | ||
| Year | Property taxes | Tax assessment |
|---|---|---|
| 2023 | $7,301 +7.6% | $102,731 +9.7% |
| 2022 | $6,783 +4.4% | $93,615 +5% |
| 2021 | $6,494 +1.9% | $89,157 +1.6% |
| 2020 | $6,375 +1.6% | $87,744 +2.9% |
| 2019 | $6,272 +4.7% | $85,271 +6.6% |
| 2018 | $5,993 +1.4% | $79,998 +2.6% |
| 2017 | $5,907 +0.1% | $77,933 +2.2% |
| 2016 | $5,902 +10.1% | $76,256 +4% |
| 2015 | $5,358 | $73,323 +4.6% |
| 2014 | $5,358 +1.7% | $70,070 |
| 2013 | $5,270 +4.1% | $70,070 |
| 2012 | $5,065 +0.4% | $70,070 -6.6% |
| 2011 | $5,046 -6% | $75,020 -10.5% |
| 2010 | $5,369 +0.6% | $83,830 -6.4% |
| 2009 | $5,339 +0.3% | $89,535 |
| 2008 | $5,324 | $89,535 +6.3% |
| 2007 | -- | $84,235 +9.2% |
| 2006 | $4,705 +2.4% | $77,114 +6.2% |
| 2005 | $4,595 -2.1% | $72,592 +1.3% |
| 2004 | $4,692 +3.8% | $71,667 +6.4% |
| 2003 | $4,520 -6.6% | $67,341 -4.7% |
| 2002 | $4,839 +20.7% | $70,639 +19.9% |
| 2001 | $4,008 +57.6% | $58,905 +65.4% |
| 2000 | $2,543 | $35,624 |
Find assessor info on the county website
Source: MRED as distributed by MLS GRID. This data may not be complete. We recommend contacting the local school district to confirm school assignments for this home.