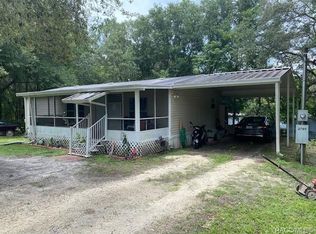
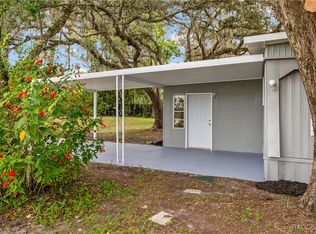
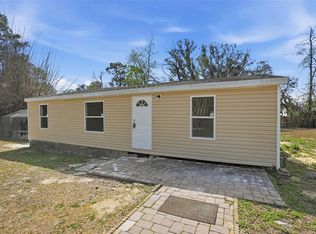
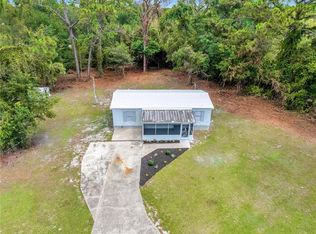
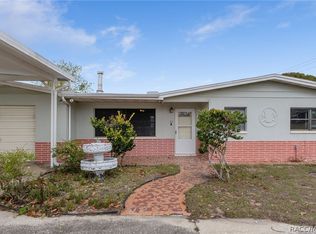
Step into this newly renovated 3 bedroom, 2 bathroom home sitting on nearly half an acre! With no lot rent and no HOA, you’ll enjoy both space and freedom. Relax and unwind on the front and back screened-in porches, perfect for morning coffee or evening libations. Inside, the home offers a clean, modern look with laminate flooring throughout for easy maintenance. The open and airy layout flows beautifully. The primary bedroom has ample closet space and en suite bathroom. The kitchen is modern with plenty of cabinet and counter space. BRAND NEW APPLIANCES (refrigerator, range and microwave)! Indoor washer and dryer hookups add everyday convenience to this abode. Brand new mini-split units help cool and heat the home quickly. The water heater is brand new - and tankless! The extra-long driveway provides plenty of room for parking. Shed in back yard will convey with the property. Metal Roof. Whether you’re searching for a personal residence or a rental investment, this home is move-in ready and waiting for you. Cash only due to age. Inverness features medical facilities, shops, and restaurants alike. Don’t miss this opportunity—schedule your showing today!
For sale
$139,900
2800 E Mars St, Inverness, FL 34453
3beds
1,344sqft
Est.:
Mobile Home
Built in 1973
0.46 Acres Lot
$-- Zestimate®
$104/sqft
$-- HOA
What's special
Metal roofClean modern lookOpen and airy layoutLaminate flooring throughoutNearly half an acre
- 6 hours |
- 143 |
- 13 |
Zillow last checked: 8 hours ago
Listing updated: 14 hours ago
Listing Provided by:
Jaimee Hibbs 402-415-3143,
ROBERT SLACK LLC 352-229-1187
Source: Stellar MLS,MLS#: OM708167 Originating MLS: Ocala - Marion
Facts & features
Interior
Bedrooms & bathrooms
- Bedrooms: 3
- Bathrooms: 2
- Full bathrooms: 2
Primary bedroom
- Features: En Suite Bathroom, Built-in Closet
- Level: First
Bedroom 2
- Features: Built-in Closet
- Level: First
Bedroom 3
- Features: Built-in Closet
- Level: First
Kitchen
- Level: First
Living room
- Level: First
Heating
- Wall Units / Window Unit
Cooling
- Ductless
Appliances
- Included: Microwave, Range, Refrigerator, Tankless Water Heater
- Laundry: Electric Dryer Hookup, Inside, Washer Hookup
Features
- Ceiling Fan(s), Open Floorplan
- Flooring: Laminate
- Windows: Blinds
- Has fireplace: No
Interior area
- Total structure area: 1,344
- Total interior livable area: 1,344 sqft
Video & virtual tour
Property
Features
- Levels: One
- Stories: 1
- Patio & porch: Front Porch, Rear Porch, Screened
- Exterior features: Lighting, Private Mailbox, Storage
Lot
- Size: 0.46 Acres
- Features: Cleared, Oversized Lot
Details
- Parcel number: 19E19S030020000G00020
- Zoning: MDRMH
- Special conditions: None
Construction
Type & style
- Home type: MobileManufactured
- Property subtype: Mobile Home
Materials
- Stucco
- Roof: Metal
Condition
- New construction: No
- Year built: 1973
Utilities & green energy
- Sewer: Septic Tank
- Water: Public
- Utilities for property: Electricity Connected, Water Connected
Community & HOA
Community
- Subdivision: HILLTOP
HOA
- Has HOA: No
- Pet fee: $0 monthly
Location
- Region: Inverness
Financial & listing details
- Price per square foot: $104/sqft
- Tax assessed value: $86,620
- Annual tax amount: $1,427
- Date on market: 8/24/2025
- Cumulative days on market: 165 days
- Listing terms: Cash
- Ownership: Fee Simple
- Total actual rent: 0
- Electric utility on property: Yes
- Road surface type: Paved, Asphalt, Concrete
- Body type: Double Wide

Jaimee Hibbs
(352) 320-5287
By pressing Contact Agent, you agree that the real estate professional identified above may call/text you about your search, which may involve use of automated means and pre-recorded/artificial voices. You don't need to consent as a condition of buying any property, goods, or services. Message/data rates may apply. You also agree to our Terms of Use. Zillow does not endorse any real estate professionals. We may share information about your recent and future site activity with your agent to help them understand what you're looking for in a home.
Estimated market value
Not available
Estimated sales range
Not available
Not available
Price history
Price history
| Date | Event | Price |
|---|---|---|
| 2/28/2026 | Listed for sale | $139,900$104/sqft |
Source: | ||
| 2/17/2026 | Listing removed | $139,900$104/sqft |
Source: | ||
| 2/10/2026 | Pending sale | $139,900$104/sqft |
Source: | ||
| 1/29/2026 | Price change | $139,900-6.7%$104/sqft |
Source: | ||
| 11/11/2025 | Price change | $150,000-3.2%$112/sqft |
Source: | ||
| 9/27/2025 | Listed for sale | $155,000$115/sqft |
Source: | ||
| 9/22/2025 | Pending sale | $155,000$115/sqft |
Source: | ||
| 8/26/2025 | Listed for sale | $155,000+210%$115/sqft |
Source: | ||
| 8/2/2024 | Sold | $50,000-23%$37/sqft |
Source: | ||
| 7/25/2024 | Pending sale | $64,900$48/sqft |
Source: | ||
| 7/17/2024 | Listed for sale | $64,900+116.3%$48/sqft |
Source: | ||
| 5/17/2024 | Sold | $30,000+20%$22/sqft |
Source: Public Record Report a problem | ||
| 8/3/2005 | Sold | $25,000$19/sqft |
Source: Public Record Report a problem | ||
Public tax history
Public tax history
| Year | Property taxes | Tax assessment |
|---|---|---|
| 2024 | $1,427 +8.8% | $84,282 +10% |
| 2023 | $1,312 +620% | $76,620 +192.4% |
| 2022 | $182 +6.5% | $26,206 +3% |
| 2021 | $171 +62.5% | $25,443 +1.4% |
| 2020 | $105 +1.3% | $25,092 +2.3% |
| 2019 | $104 +31.6% | $24,528 +1.9% |
| 2018 | $79 | $24,071 +2.1% |
| 2017 | $79 | $23,576 +2.1% |
| 2016 | $79 | $23,091 +0.7% |
| 2015 | $79 +6.8% | $22,930 -9.1% |
| 2014 | $74 +184.4% | $25,230 +0.7% |
| 2013 | $26 -59.6% | $25,060 -8.9% |
| 2012 | $64 -34% | $27,501 -7.1% |
| 2011 | $98 -56% | $29,592 -21.5% |
| 2010 | $222 -28% | $37,689 -11.1% |
| 2009 | $308 -20.2% | $42,415 -10.4% |
| 2008 | $386 -5.2% | $47,356 -3.9% |
| 2007 | $407 -26.6% | $49,300 -9% |
| 2006 | $554 +602.2% | $54,200 +93.6% |
| 2005 | $79 +19% | $28,000 +2.9% |
| 2004 | $66 +18.6% | $27,200 +1.9% |
| 2003 | $56 +174.8% | $26,700 +2.3% |
| 2002 | $20 -57.8% | $26,100 -2.2% |
| 2000 | $48 | $26,700 |
Find assessor info on the county website
BuyAbility℠ payment
Est. payment
$825/mo
Principal & interest
$644
Property taxes
$181
Climate risks
Neighborhood: 34453
Nearby schools
GreatSchools rating
- 3/10Hernando Elementary SchoolGrades: PK-5Distance: 2.5 mi
- 4/10Inverness Middle SchoolGrades: 6-8Distance: 2.8 mi
- NACitrus Virtual Instruction ProgramGrades: K-12Distance: 3.2 mi