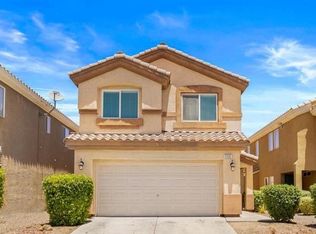
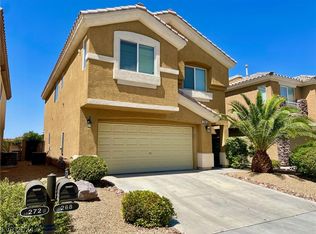
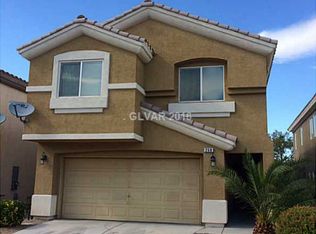
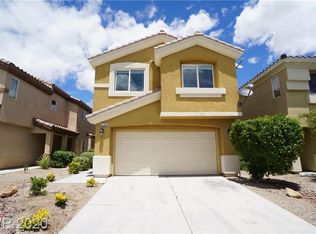
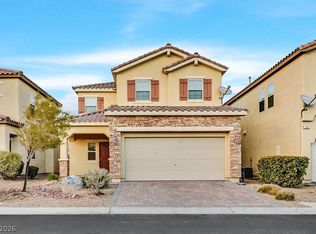
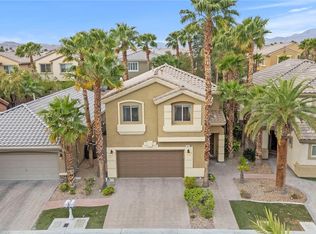
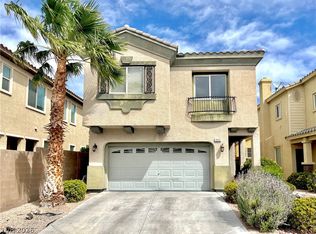
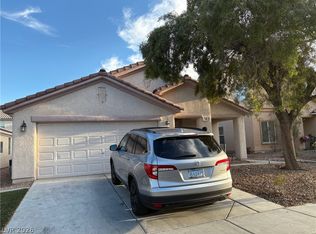
OWNERS PRIDE AND JOY IN RHODES RANCH. THIS 4 BEDROOM HOME WITH OVER $50K IN UPGRADES IS A MUST SEE . PLEASE MAKE SURE TO REVIEW THIS GREAT COMMUNITY WITH ALL THE AMENITIES SUCH AS GOLF COURSE, COMMUNITY CENTER. HOUSE IS AVAILABLE TO BE SHOWN BEFORE OPEN HOUSE WITH YOUR AGENT. 1% DOWN IS AVAILABLE
Pre-foreclosure
Est. $509,100
262 Soggy Ruff Way, Las Vegas, NV 89148
4beds
2,251sqft
SingleFamily
Built in 2004
3,049 Square Feet Lot
$509,100 Zestimate®
$226/sqft
$170/mo HOA
Overview
- 258 days |
- 15 |
- 0 |
Facts & features
Interior
Bedrooms & bathrooms
- Bedrooms: 4
- Bathrooms: 3
- Full bathrooms: 3
Heating
- Forced air, Gas
Cooling
- Central
Appliances
- Included: Microwave
Features
- Flooring: Tile, Carpet
Interior area
- Total interior livable area: 2,251 sqft
Property
Parking
- Total spaces: 2
- Parking features: Garage - Attached
Features
- Exterior features: Stucco
Lot
- Size: 3,049 Square Feet
Details
- Parcel number: 17608316036
- Zoning: Single Family
Construction
Type & style
- Home type: SingleFamily
Materials
- Frame
- Roof: Tile
Condition
- Year built: 2004
Utilities & green energy
- Sewer: Public
Community & HOA
HOA
- Has HOA: Yes
- HOA fee: $170 monthly
Location
- Region: Las Vegas
Financial & listing details
- Price per square foot: $226/sqft
- Tax assessed value: $355,980
- Annual tax amount: $4,828
Visit our professional directory to find a foreclosure specialist in your area that can help with your home search.
Find a foreclosure agentForeclosure details
Estimated market value
$509,100
$484,000 - $535,000
$2,222/mo
Price history
| Date | Event | Price |
|---|---|---|
| 12/29/2021 | Sold | $475,000+2.2%$211/sqft |
Source: | ||
| 11/19/2021 | Pending sale | $465,000$207/sqft |
Source: | ||
| 11/17/2021 | Listed for sale | $465,000+36.8%$207/sqft |
Source: | ||
| 5/30/2018 | Sold | $339,999$151/sqft |
Source: | ||
| 4/9/2018 | Pending sale | $339,999$151/sqft |
Source: Allure Realty Group LLC #1977638 Report a problem | ||
| 3/28/2018 | Price change | $339,9990%$151/sqft |
Source: Allure Realty Group LLC #1977638 Report a problem | ||
| 3/21/2018 | Listed for sale | $340,000+33.3%$151/sqft |
Source: Allure Realty Group LLC #1977638 Report a problem | ||
| 1/10/2014 | Sold | $255,000-3.6%$113/sqft |
Source: | ||
| 11/12/2013 | Price change | $264,500-2.9%$118/sqft |
Source: Keller Williams Realty Southwest #1398167 Report a problem | ||
| 10/11/2013 | Price change | $272,500-4.4%$121/sqft |
Source: Homepath #1358972 Report a problem | ||
| 9/11/2013 | Price change | $284,900-5%$127/sqft |
Source: Keller Williams Realty Southwest #1358972 Report a problem | ||
| 8/7/2013 | Price change | $299,900-6%$133/sqft |
Source: Keller Williams Realty Southwest #1358972 Report a problem | ||
| 6/25/2013 | Listed for sale | $319,000-11%$142/sqft |
Source: Homepath Report a problem | ||
| 5/2/2013 | Sold | $358,569-19.8%$159/sqft |
Source: Public Record Report a problem | ||
| 11/30/2005 | Sold | $446,990$199/sqft |
Source: Public Record Report a problem | ||
Public tax history
| Year | Property taxes | Tax assessment |
|---|---|---|
| 2025 | $4,828 +40.2% | $124,593 +8.2% |
| 2024 | $3,444 +17.8% | $115,106 +9.3% |
| 2023 | $2,924 +8% | $105,316 +5.9% |
| 2022 | $2,707 +7.7% | $99,460 +0.7% |
| 2021 | $2,513 +6.7% | $98,809 +3.7% |
| 2020 | $2,355 +4.8% | $95,272 +6.8% |
| 2019 | $2,247 +6.9% | $89,192 |
| 2018 | $2,102 | $89,192 -0.9% |
| 2017 | $2,102 | $89,981 +8% |
| 2016 | $2,102 +3.2% | $83,310 +5.4% |
| 2015 | $2,036 | $79,046 +18.8% |
| 2014 | $2,036 | $66,512 |
| 2013 | -- | $66,512 +1.5% |
| 2012 | -- | $65,545 +1.2% |
| 2011 | -- | $64,757 +4.1% |
| 2010 | -- | $62,230 -26.2% |
| 2009 | -- | $84,309 |
| 2008 | -- | $84,309 -43.2% |
| 2007 | -- | $148,419 +12.5% |
| 2006 | -- | $131,955 +32% |
| 2005 | -- | $99,939 |
Find assessor info on the county website
Monthly payment
Estimated monthly payment
All calculations are estimates and provided by Zillow, Inc. for informational purposes only. Actual amounts may vary.
HOA fees may include property taxes on listings classified as Co-Ops. Contact the listing agent and/or owner for fee details.
Mortgage interest rates are dependent on a number of factors, including credit score, down payment, and repayment length. Interest rate data provided by Zillow Group Marketplace, Inc. as of 1/1/1970 from various mortgage lenders with which we have lead or other similar arrangements; the Estimated Payment is an average of those rates.
See how much you could borrow to make a competitive offer.
Climate risks
Neighborhood: Spring Valley
Nearby schools
GreatSchools rating
- 6/10Don and Dee Snyder Elementary SchoolGrades: PK-5Distance: 1.2 mi
- 6/10Wilbur & Theresa Faiss Middle SchoolGrades: 6-8Distance: 1.1 mi
- 4/10Sierra Vista High SchoolGrades: 9-12Distance: 1.5 mi
Schools provided by the listing agent
- Elementary: Forbuss/ Robert L
- Middle: Faiss/ Wilbur & Theresa
- High: Sierra Vista High
Source: The MLS. This data may not be complete. We recommend contacting the local school district to confirm school assignments for this home.
- Nevada
- Clark County
- Las Vegas
- 89148
- Spring Valley
- 262 Soggy Ruff Way
Nearby cities
Nearby neighborhoods
Nearby zip codes
Other Las Vegas Topics
