$700,600
-- bd|3 ba|3.4k sqft
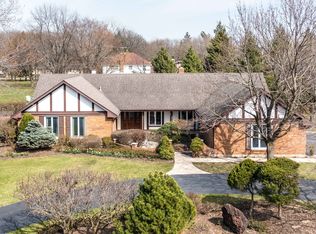
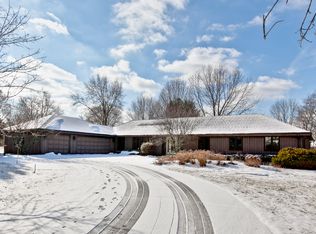
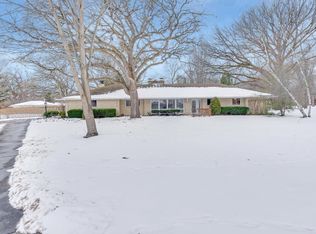
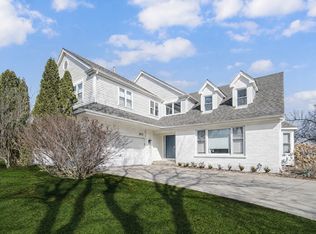
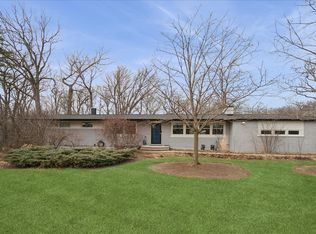
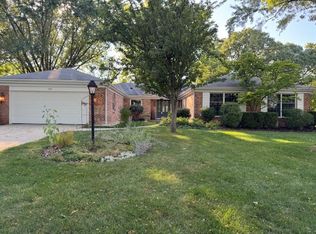
2529 Shenandoah Ln, Long Grove, IL 60047
Off Market
Zillow last checked: 8 hours ago
Listing updated: February 02, 2026 at 05:58pm
Anna Pieta 773-467-8500,
Landmark Realtors
$831,200
$790,000 - $873,000
$4,018/mo
| Date | Event | Price |
|---|---|---|
| 2/3/2026 | Contingent | $839,000$292/sqft |
Source: | ||
| 1/31/2026 | Price change | $839,000-4.6%$292/sqft |
Source: | ||
| 1/27/2026 | Listed for sale | $879,000$306/sqft |
Source: | ||
| 1/27/2026 | Listing removed | $879,000$306/sqft |
Source: | ||
| 1/21/2026 | Price change | $879,000-2.2%$306/sqft |
Source: | ||
| 12/13/2025 | Listed for sale | $899,000+55%$313/sqft |
Source: | ||
| 8/18/2025 | Sold | $580,000-5.7%$202/sqft |
Source: | ||
| 8/7/2025 | Contingent | $615,000$214/sqft |
Source: | ||
| 7/31/2025 | Listed for sale | $615,000-2.4%$214/sqft |
Source: | ||
| 7/17/2025 | Contingent | $629,900$219/sqft |
Source: | ||
| 7/10/2025 | Listed for sale | $629,900+57.5%$219/sqft |
Source: | ||
| 5/13/2023 | Listing removed | -- |
Source: Zillow Rentals Report a problem | ||
| 4/20/2023 | Listed for rent | $4,250$1/sqft |
Source: Zillow Rentals Report a problem | ||
| 11/5/2021 | Sold | $400,000$139/sqft |
Source: | ||
| 8/10/2021 | Contingent | $400,000$139/sqft |
Source: | ||
| 8/7/2021 | Listed for sale | $400,000-16.6%$139/sqft |
Source: | ||
| 9/4/2015 | Listing removed | $479,900$167/sqft |
Source: Baird & Warner #08718194 Report a problem | ||
| 9/4/2014 | Listed for sale | $479,900$167/sqft |
Source: Baird & Warner Real Estate #08718194 Report a problem | ||
| Year | Property taxes | Tax assessment |
|---|---|---|
| 2023 | $15,361 +23.9% | $168,167 +2.8% |
| 2022 | $12,403 +1507.7% | $163,650 +22.7% |
| 2021 | $771 | $133,320 -19.7% |
| 2020 | -- | $165,982 +0.9% |
| 2019 | -- | $164,534 +0.2% |
| 2018 | $13,298 | $164,215 +1.2% |
| 2017 | $13,298 +3.1% | $162,235 +3.3% |
| 2016 | $12,898 +13% | $157,098 +5% |
| 2015 | $11,414 -2.5% | $149,631 +15.1% |
| 2014 | $11,711 +4.4% | $130,022 -0.2% |
| 2012 | $11,213 +0.5% | $130,295 -7.7% |
| 2011 | $11,156 -2.1% | $141,205 -11.1% |
| 2010 | $11,399 +4% | $158,819 -4% |
| 2009 | $10,963 +3.7% | $165,436 +2.1% |
| 2008 | $10,575 +8.2% | $162,080 +1.4% |
| 2006 | $9,775 +12.5% | $159,835 |
| 2005 | $8,685 +11.7% | -- |
| 2004 | $7,775 +0.8% | -- |
| 2003 | $7,710 +11.1% | -- |
| 2002 | $6,939 +110.5% | -- |
| 2001 | $3,297 -48.2% | $102,000 +2.7% |
| 2000 | $6,362 | $99,317 |
Find assessor info on the county website
Source: MRED as distributed by MLS GRID. This data may not be complete. We recommend contacting the local school district to confirm school assignments for this home.