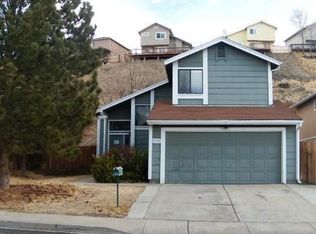
This 1338 square foot single family home has 3 bedrooms and 2.5 bathrooms. This home is located at 2340 Melody Ln, Reno, NV 89512.
Pre-foreclosure
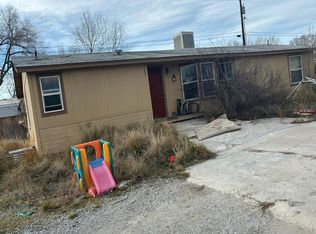
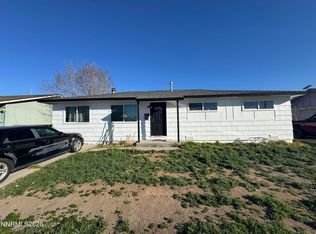
Street View
Est. $417,500
2340 Melody Ln, Reno, NV 89512
3beds
2baths
1,338sqft
SingleFamily
Built in 1985
8,625 Square Feet Lot
$417,500 Zestimate®
$312/sqft
$-- HOA
Overview
- 127 days |
- 25 |
- 0 |
Facts & features
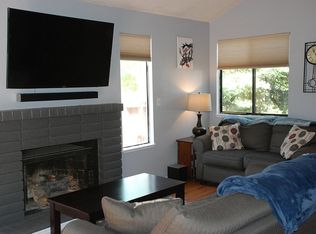
Interior
Bedrooms & bathrooms
- Bedrooms: 3
- Bathrooms: 2.5
Heating
- Forced air
Features
- Has fireplace: Yes
Interior area
- Total interior livable area: 1,338 sqft
Property
Parking
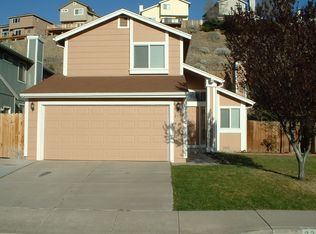
- Parking features: Garage - Attached
Features
- Exterior features: Stucco
Lot
- Size: 8,625 Square Feet
Details
- Parcel number: 02652508
Construction
Type & style
- Home type: SingleFamily
Materials
- Frame
- Roof: Composition
Condition
- Year built: 1985
Community & HOA
Location
- Region: Reno
Financial & listing details
- Price per square foot: $312/sqft
- Tax assessed value: $211,789
- Annual tax amount: $1,378
Visit our professional directory to find a foreclosure specialist in your area that can help with your home search.
Find a foreclosure agentForeclosure details
Estimated market value
$417,500
$388,000 - $443,000
$2,159/mo
Price history
Price history
| Date | Event | Price |
|---|---|---|
| 7/18/2014 | Sold | $175,000+34.5%$131/sqft |
Source: Public Record Report a problem | ||
| 4/1/2014 | Sold | $130,100+11.7%$97/sqft |
Source: Public Record Report a problem | ||
| 7/7/1995 | Sold | $116,500$87/sqft |
Source: Public Record Report a problem | ||
Public tax history
Public tax history
| Year | Property taxes | Tax assessment |
|---|---|---|
| 2025 | $1,378 +3% | $74,126 +12.8% |
| 2024 | $1,338 +3% | $65,707 -1.4% |
| 2023 | $1,299 +3% | $66,615 +15.9% |
| 2022 | $1,262 +3.1% | $57,495 +20.6% |
| 2021 | $1,224 +3% | $47,664 +3.2% |
| 2020 | $1,189 -2.9% | $46,189 |
| 2019 | $1,224 +3% | $46,189 +15% |
| 2018 | $1,189 +8.6% | $40,174 -0.2% |
| 2017 | $1,094 | $40,254 +5.4% |
| 2016 | $1,094 | $38,197 +0.8% |
| 2015 | $1,094 +0.3% | $37,876 +8.4% |
| 2014 | $1,091 -32.1% | $34,953 +26% |
| 2013 | $1,607 | $27,740 -14.3% |
| 2012 | -- | $32,380 -4.3% |
| 2011 | -- | $33,824 |
| 2010 | -- | $33,824 -24.1% |
| 2009 | -- | $44,589 -14.7% |
| 2008 | -- | $52,260 |
| 2007 | -- | $52,260 +10.1% |
| 2006 | -- | $47,460 +17.7% |
| 2005 | -- | $40,307 +9% |
| 2004 | -- | $36,990 +2.3% |
| 2003 | -- | $36,168 +0.6% |
| 2002 | -- | $35,937 |
| 2001 | -- | $35,937 |
Find assessor info on the county website
BuyAbility℠ payment
Estimated monthly payment
Boost your down payment with 6% savings match
Earn up to a 6% match & get a competitive APY with a *. Zillow has partnered with to help get you home faster.
Learn more*Terms apply. Match provided by Foyer. Account offered by Pacific West Bank, Member FDIC.Climate risks
Neighborhood: Northeast
Nearby schools
GreatSchools rating
- 1/10Bernice Mathews Elementary SchoolGrades: PK-5Distance: 1.5 mi
- 5/10Fred W Traner Middle SchoolGrades: 6-8Distance: 1.4 mi
- 2/10Procter R Hug High SchoolGrades: 9-12Distance: 0.9 mi