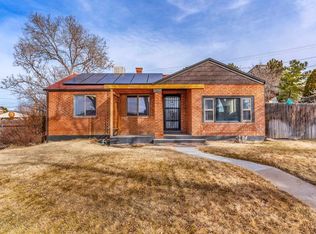
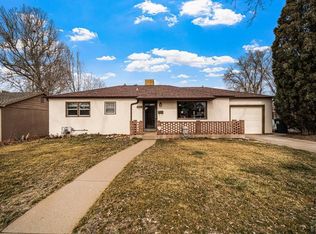
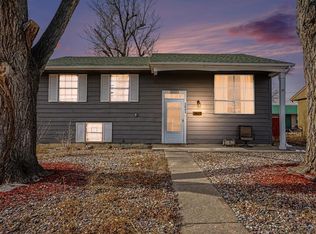
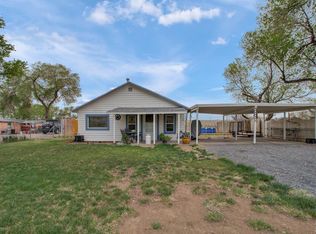
Nice 3 bedroom 2 bath home on the a corner lot and close to HWY and restaurants. Also only minutes away from Parkview Hospital.
Owner pays Electric tenant is responsible for all other utilities and must main tame the yard. One year lease
Pre-foreclosure
Est. $283,600
2321 Montezuma Rd, Pueblo, CO 81003
3beds
1,503sqft
Single Family Residence
Built in ----
-- sqft lot
$283,600 Zestimate®
$189/sqft
$-- HOA
What's special
Corner lot
- 59 days |
- 28 |
- 4 |
Zillow last checked: 8 hours ago
Listing updated: June 20, 2025 at 01:47pm
Source: Zillow Rentals
Facts & features
Interior
Bedrooms & bathrooms
- Bedrooms: 3
- Bathrooms: 2
- Full bathrooms: 2
Appliances
- Included: Dishwasher, Dryer, Freezer, Microwave, Oven, Refrigerator, Washer
- Laundry: In Unit
Features
- Flooring: Carpet, Hardwood, Tile
Interior area
- Total interior livable area: 1,503 sqft
Property
Parking
- Parking features: Attached, Off Street
- Has attached garage: Yes
- Details: Contact manager
Features
- Exterior features: Electricity not included in rent
Details
- Parcel number: 524331014
Construction
Type & style
- Home type: SingleFamily
- Property subtype: Single Family Residence
Community & HOA
HOA
- Deposit fee: $2,200
- Pet deposit fee: $150
Location
- Region: Pueblo
Financial & listing details
- Price per square foot: $189/sqft
- Tax assessed value: $278,495
- Annual tax amount: $1,448
- Date on market: 6/20/2025
- Date available: 08/15/2025
- Lease term: 1 Year
Visit our professional directory to find a foreclosure specialist in your area that can help with your home search.
Find a foreclosure agentForeclosure details
Estimated market value
$283,600
$269,000 - $298,000
$1,845/mo
Price history
Price history
| Date | Event | Price |
|---|---|---|
| 7/9/2025 | Listing removed | $2,200$1/sqft |
Source: Zillow Rentals Report a problem | ||
| 6/20/2025 | Listed for rent | $2,200$1/sqft |
Source: Zillow Rentals Report a problem | ||
| 1/20/2025 | Listing removed | $269,900$180/sqft |
Source: | ||
| 10/23/2024 | Price change | $269,900-1.9%$180/sqft |
Source: | ||
| 8/29/2024 | Listed for sale | $275,000$183/sqft |
Source: | ||
| 8/26/2024 | Contingent | $275,000$183/sqft |
Source: | ||
| 8/19/2024 | Listed for sale | $275,000+8.9%$183/sqft |
Source: | ||
| 12/22/2021 | Sold | $252,500+3.1%$168/sqft |
Source: | ||
| 11/18/2021 | Pending sale | $244,900$163/sqft |
Source: | ||
| 11/14/2021 | Listed for sale | $244,900$163/sqft |
Source: | ||
| 10/26/2021 | Listing removed | -- |
Source: | ||
| 10/22/2021 | Listed for sale | $244,900+11.8%$163/sqft |
Source: | ||
| 10/9/2020 | Sold | $219,000+0%$146/sqft |
Source: | ||
| 9/8/2020 | Pending sale | $218,900$146/sqft |
Source: RE/MAX Of Pueblo Inc #188196 Report a problem | ||
| 9/1/2020 | Listed for sale | $218,900+90.3%$146/sqft |
Source: RE/MAX Of Pueblo Inc #188196 Report a problem | ||
| 1/12/2016 | Sold | $115,000-4.2%$77/sqft |
Source: Public Record Report a problem | ||
| 11/25/2015 | Listed for sale | $120,000$80/sqft |
Source: Jones-Healy Realtors #158956 Report a problem | ||
Public tax history
Public tax history
| Year | Property taxes | Tax assessment |
|---|---|---|
| 2024 | $1,448 +8.5% | $18,660 -1% |
| 2023 | $1,334 -3.1% | $18,840 +37.6% |
| 2022 | $1,377 +35.7% | $13,695 -2.8% |
| 2021 | $1,015 0% | $14,090 +37.6% |
| 2020 | $1,015 +21% | $10,241 +10.7% |
| 2018 | $839 | $9,255 |
| 2017 | $839 +115.3% | $9,255 +6.4% |
| 2016 | $390 | $8,695 |
| 2015 | $390 +99.6% | $8,695 +2.6% |
| 2014 | $195 -52.3% | $8,475 |
| 2013 | $409 -56.7% | $8,475 -3.9% |
| 2012 | $946 | $8,820 |
| 2011 | $946 +3.2% | $8,820 -12.3% |
| 2010 | $917 +110.4% | $10,062 +0% |
| 2009 | $436 -1.8% | $10,060 +6.8% |
| 2008 | $444 -46.8% | $9,420 |
| 2007 | $833 +4.5% | $9,420 +10.6% |
| 2006 | $798 +0.5% | $8,520 +5.1% |
| 2005 | $794 +1.4% | $8,110 |
| 2004 | $783 -7.2% | $8,110 -1% |
| 2003 | $843 +10.8% | $8,190 -7.9% |
| 2002 | $761 +7.8% | $8,890 +1.7% |
| 2001 | $706 | $8,740 |
Find assessor info on the county website
BuyAbility℠ payment
Estimated monthly payment
Boost your down payment with 6% savings match
Earn up to a 6% match & get a competitive APY with a *. Zillow has partnered with to help get you home faster.
Learn more*Terms apply. Match provided by Foyer. Account offered by Pacific West Bank, Member FDIC.Climate risks
Neighborhood: Northside
Nearby schools
GreatSchools rating
- NAHeroes Academy PREK-5Grades: PK-5Distance: 0.5 mi
- NAFreed Middle SchoolGrades: 6-8Distance: 0.4 mi
- 3/10Centennial High SchoolGrades: 9-12Distance: 1.3 mi