$222,800
3 bd|1 ba|800 sqft
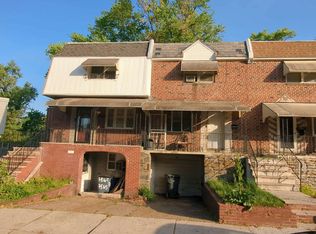
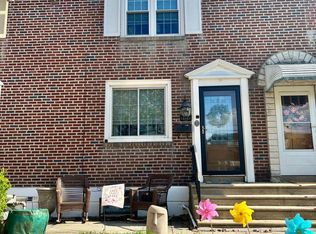
220 Hoffman Rd, Ridley Park, PA 19078
Off Market
Zillow last checked: 7 hours ago
Listing updated: April 10, 2026 at 03:12am
Tom Toole III 610-692-6976,
RE/MAX Main Line-West Chester 6106922228,
Listing Team: Tom Toole Sales Group At Re/Max Main Line, Co-Listing Agent: Keith Robert Lombardi 610-955-1387,
RE/MAX Main Line-West Chester
Not available
Estimated sales range
Not available
Not available
| Date | Event | Price |
|---|---|---|
| 7/19/2019 | Sold | $154,000-9.4%$193/sqft |
Source: Public Record Report a problem | ||
| 5/26/2019 | Pending sale | $169,999$212/sqft |
Source: Tesla Realty Group LLC #PADE489110 Report a problem | ||
| 5/22/2019 | Price change | $169,999+6.3%$212/sqft |
Source: Tesla Realty Group LLC #PADE489110 Report a problem | ||
| 5/19/2019 | Listed for sale | $159,999+88.2%$200/sqft |
Source: Tesla Realty Group LLC #PADE489110 Report a problem | ||
| 12/27/2018 | Sold | $85,000-39.3%$106/sqft |
Source: Public Record Report a problem | ||
| 6/1/2018 | Listed for sale | $140,000+33.3%$175/sqft |
Source: C-21 Advantage Gold-S Philadel #1001736902 Report a problem | ||
| 3/4/2014 | Sold | $105,000$131/sqft |
Source: Public Record Report a problem | ||
| 2/5/2014 | Pending sale | $105,000$131/sqft |
Source: BHHS Fox & Roach-Media #6332038 Report a problem | ||
| 1/30/2014 | Listed for sale | $105,000$131/sqft |
Source: BHHS Fox & Roach-Media #6332038 Report a problem | ||
| Year | Property taxes | Tax assessment |
|---|---|---|
| 2025 | $4,639 +2.1% | $130,880 |
| 2024 | $4,544 +4.5% | $130,880 |
| 2023 | $4,347 +3.3% | $130,880 |
| 2022 | $4,207 | $130,880 |
| 2021 | $4,207 +919.7% | $130,880 +73.2% |
| 2020 | $413 -1.5% | $75,550 |
| 2019 | $419 -89.9% | $75,550 |
| 2018 | $4,138 +898% | $75,550 |
| 2017 | $415 -2% | $75,550 |
| 2016 | $423 +2% | $75,550 |
| 2015 | $415 -2% | $75,550 |
| 2014 | $423 +2.8% | $75,550 |
| 2013 | $412 +2.8% | $75,550 |
| 2012 | $400 +2.3% | $75,550 |
| 2011 | $391 | $75,550 |
| 2010 | $391 +7.5% | $75,550 |
| 2009 | $364 +2% | $75,550 |
| 2008 | $357 +8.3% | $75,550 |
| 2007 | $329 -2% | $75,550 |
| 2006 | $336 | $75,550 |
| 2005 | $336 +2% | $75,550 |
| 2004 | $329 +6.4% | $75,550 |
| 2003 | $310 +7.9% | $75,550 |
| 2002 | $287 | $75,550 |
| 2000 | $287 | $75,550 |
Find assessor info on the county website
Source: Bright MLS. This data may not be complete. We recommend contacting the local school district to confirm school assignments for this home.