$626,300
4 bd|1 ba|1.6k sqft
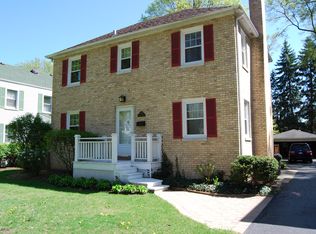
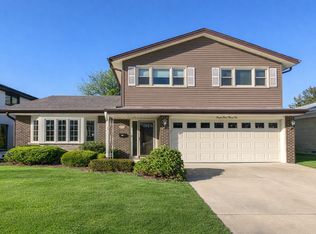
2121 Illinois Rd, Northbrook, IL 60062
Off Market
Zillow last checked: 8 hours ago
Listing updated: February 25, 2026 at 12:02am
C Bryce Fuller 847-208-7888,
Baird & Warner
Not available
Estimated sales range
Not available
Not available
| Date | Event | Price |
|---|---|---|
| 2/18/2026 | Listing removed | $755,000$312/sqft |
Source: | ||
| 2/14/2026 | Listed for sale | $755,000$312/sqft |
Source: | ||
| 2/5/2026 | Contingent | $755,000$312/sqft |
Source: | ||
| 2/2/2026 | Listed for sale | $755,000-4.2%$312/sqft |
Source: | ||
| 1/28/2026 | Contingent | $788,000$325/sqft |
Source: | ||
| 9/4/2025 | Listed for sale | $788,000-0.9%$325/sqft |
Source: | ||
| 9/4/2025 | Listing removed | $795,000$328/sqft |
Source: | ||
| 6/20/2025 | Price change | $795,000-2.9%$328/sqft |
Source: | ||
| 5/3/2025 | Price change | $819,000-5.8%$338/sqft |
Source: | ||
| 4/3/2025 | Price change | $869,000-3.3%$359/sqft |
Source: | ||
| 3/17/2025 | Listed for sale | $899,000+208.7%$371/sqft |
Source: | ||
| 1/8/2003 | Sold | $291,250-24.9%$120/sqft |
Source: Public Record Report a problem | ||
| 12/29/1997 | Sold | $388,000+75.6%$160/sqft |
Source: Public Record Report a problem | ||
| 3/19/1997 | Sold | $221,000$91/sqft |
Source: Public Record Report a problem | ||
| Year | Property taxes | Tax assessment |
|---|---|---|
| 2023 | $9,744 -23.6% | $45,967 -24.6% |
| 2022 | $12,759 +17.3% | $61,000 +30.1% |
| 2021 | $10,880 +1.5% | $46,881 |
| 2020 | $10,718 -2% | $46,881 -13.2% |
| 2019 | $10,935 -8.9% | $53,980 -1.3% |
| 2018 | $12,001 +2.5% | $54,682 |
| 2017 | $11,704 +4.5% | $54,682 |
| 2016 | $11,197 +20.9% | $54,682 +31.1% |
| 2015 | $9,261 +4.5% | $41,715 |
| 2014 | $8,859 -6.5% | $41,715 -9% |
| 2013 | $9,478 -5.5% | $45,844 -12.1% |
| 2012 | $10,034 +7.7% | $52,172 |
| 2011 | $9,316 +9.2% | $52,172 |
| 2010 | $8,529 -5.4% | $52,172 -11.2% |
| 2009 | $9,016 +8.9% | $58,772 -9.6% |
| 2008 | $8,277 +6.6% | $64,979 |
| 2007 | $7,766 +29.4% | $64,979 +63.9% |
| 2006 | $6,000 +10.6% | $39,657 |
| 2005 | $5,425 +3.1% | $39,657 |
| 2004 | $5,264 -5.2% | $39,657 +10.1% |
| 2003 | $5,555 +2.3% | $36,008 |
| 2002 | $5,429 +26% | $36,008 |
| 2001 | $4,310 +3.3% | $36,008 +40.7% |
| 2000 | $4,170 | $25,584 |
| 1999 | $4,170 | $25,584 |
Find assessor info on the county website
Source: MRED as distributed by MLS GRID. This data may not be complete. We recommend contacting the local school district to confirm school assignments for this home.