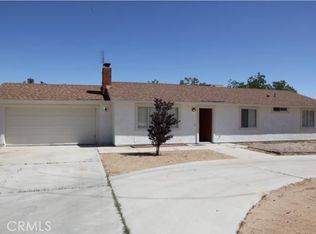
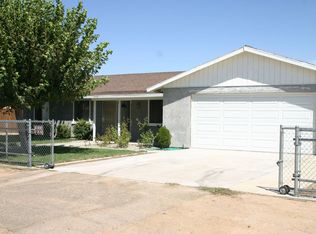
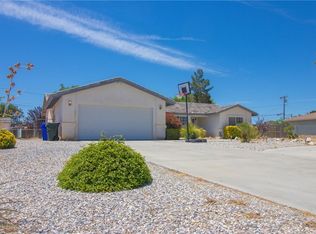
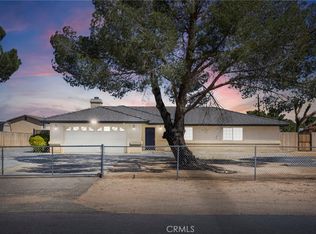
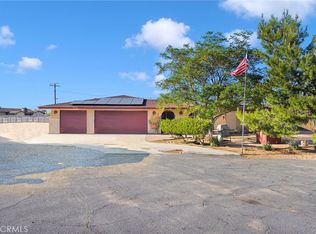
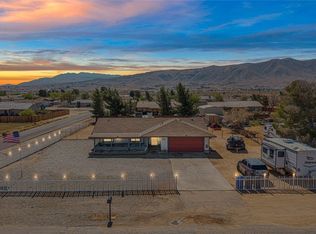
This 1716 square foot single family home has 3 bedrooms and 2.0 bathrooms. This home is located at 21130 Sandia Rd, Apple Valley, CA 92308.
Pre-foreclosure
Est. $456,500
21130 Sandia Rd, Apple Valley, CA 92308
3beds
1,716sqft
SingleFamily
Built in 1978
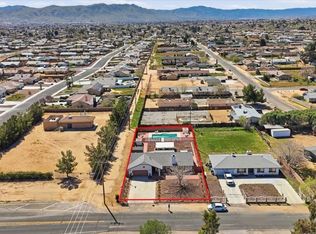
0.44 Acres Lot
$456,500 Zestimate®
$266/sqft
$-- HOA
Overview
- 114 days |
- 44 |
- 1 |
Facts & features
Interior
Bedrooms & bathrooms
- Bedrooms: 3
- Bathrooms: 2
- Full bathrooms: 2
Heating
- Forced air, Gas
Cooling
- Central
Appliances
- Included: Dishwasher, Garbage disposal, Microwave, Range / Oven
- Laundry: In Closet
Features
- Flooring: Tile, Carpet, Laminate
- Basement: None
- Has fireplace: Yes
- Common walls with other units/homes: No Common Walls
Interior area
- Total interior livable area: 1,716 sqft
Property
Parking
- Total spaces: 4
- Parking features: Garage - Attached, Off-street
Features
- Levels: One
- Exterior features: Wood
- Spa features: In Ground
- Has view: Yes
- View description: Mountain
Lot
- Size: 0.44 Acres
- Features: Back Yard, Front Yard, Lot 10000-19999 Sqft
Details
- Parcel number: 0434405030000
- Special conditions: Standard
Construction
Type & style
- Home type: SingleFamily
Materials
- wood frame
- Roof: Tile
Condition
- Year built: 1978
Utilities & green energy
- Water: Private
Community & HOA
Location
- Region: Apple Valley
Financial & listing details
- Price per square foot: $266/sqft
- Tax assessed value: $440,401
- Annual tax amount: $5,796
Visit our professional directory to find a foreclosure specialist in your area that can help with your home search.
Find a foreclosure agentForeclosure details
Estimated market value
$456,500
$434,000 - $479,000
$2,595/mo
Price history
Price history
| Date | Event | Price |
|---|---|---|
| 6/15/2022 | Sold | $415,000+3.8%$242/sqft |
Source: Public Record Report a problem | ||
| 5/19/2022 | Pending sale | $400,000$233/sqft |
Source: | ||
| 5/13/2022 | Listed for sale | $400,000+73.9%$233/sqft |
Source: | ||
| 10/6/2017 | Sold | $230,000-2.1%$134/sqft |
Source: Public Record Report a problem | ||
| 9/7/2017 | Pending sale | $235,000$137/sqft |
Source: DYNASTY REAL ESTATE #IV17196841 Report a problem | ||
| 8/25/2017 | Listed for sale | $235,000+27.7%$137/sqft |
Source: Dynasty Real Estate #489685 Report a problem | ||
| 3/31/2015 | Sold | $184,000-0.5%$107/sqft |
Source: Public Record Report a problem | ||
| 1/8/2015 | Listed for sale | $184,900+45.6%$108/sqft |
Source: RE/MAX PARTNERS #IG15004096 Report a problem | ||
| 4/25/2014 | Sold | $127,000+139.6%$74/sqft |
Source: Public Record Report a problem | ||
| 3/18/1999 | Sold | $53,000$31/sqft |
Source: Public Record Report a problem | ||
Public tax history
Public tax history
| Year | Property taxes | Tax assessment |
|---|---|---|
| 2025 | $5,796 -3.2% | $440,401 +2% |
| 2024 | $5,990 +12.3% | $431,766 +2% |
| 2023 | $5,332 +82% | $423,300 +71.7% |
| 2022 | $2,931 +2.3% | $246,606 +2% |
| 2021 | $2,864 +1.2% | $241,771 +1% |
| 2020 | $2,829 +1.9% | $239,292 +2% |
| 2019 | $2,777 -2.9% | $234,600 +2% |
| 2018 | $2,859 +0.7% | $230,000 +20.9% |
| 2017 | $2,839 | $190,231 +2% |
| 2016 | $2,839 +30.4% | $186,501 +44.2% |
| 2015 | $2,177 +42.3% | $129,334 +90.8% |
| 2014 | $1,530 | $67,780 +0.5% |
| 2013 | -- | $67,474 +2% |
| 2012 | -- | $66,151 +2% |
| 2011 | -- | $64,853 +0.8% |
| 2010 | -- | $64,369 -0.2% |
| 2009 | -- | $64,522 +2% |
| 2008 | -- | $63,257 +2% |
| 2007 | -- | $62,017 +2% |
| 2006 | -- | $60,801 +2% |
| 2005 | -- | $59,608 +2% |
| 2004 | -- | $58,439 +1.9% |
| 2003 | -- | $57,368 +2% |
| 2002 | -- | $56,243 +2% |
| 2001 | -- | $55,141 +2% |
| 2000 | -- | $54,060 |
Find assessor info on the county website
Monthly payment
Estimated monthly payment
All calculations are estimates and provided by Zillow, Inc. for informational purposes only. Actual amounts may vary.
HOA fees may include property taxes on listings classified as Co-Ops. Contact the listing agent and/or owner for fee details.
Mortgage interest rates are dependent on a number of factors, including credit score, down payment, and repayment length. Interest rate data provided by Zillow Group Marketplace, Inc. as of 1/1/1970 from various mortgage lenders with which we have lead or other similar arrangements; the Estimated Payment is an average of those rates.
See how much you could borrow to make a competitive offer.
Climate risks
Neighborhood: 92308
Nearby schools
GreatSchools rating
- 3/10Sandia Elementary SchoolGrades: K-8Distance: 0.3 mi
- 5/10Apple Valley High SchoolGrades: 9-12Distance: 0.8 mi
Schools provided by the listing agent
- District: Apply Valley Unified
Source: The MLS. This data may not be complete. We recommend contacting the local school district to confirm school assignments for this home.
- California
- San Bernardino County
- Apple Valley
- 92308
- 21130 Sandia Rd
Nearby cities
Nearby zip codes
Other Apple Valley Topics
