.
Foreclosed
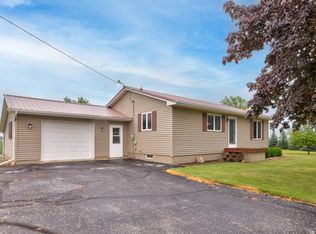
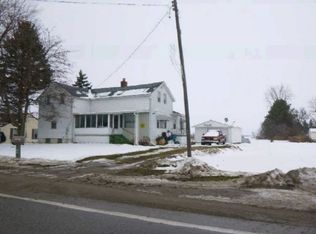
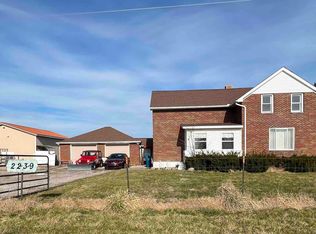
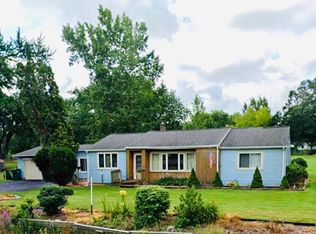
Street View
Est. $149,000
2104 S Tuscola Rd, Munger, MI 48747
3beds
1,753sqft
SingleFamily
Built in ----
0.7 Acres Lot
$-- Zestimate®
$85/sqft
$-- HOA
Overview
- 24 days |
- 32 |
- 0 |
Facts & features
Interior
Bedrooms & bathrooms
- Bedrooms: 3
- Bathrooms: 2
- Full bathrooms: 2
Heating
- Baseboard, Stove, Wood / Pellet
Features
- Flooring: Tile, Carpet, Laminate
- Basement: Partially finished
Interior area
- Total interior livable area: 1,753 sqft
Property
Parking
- Parking features: Garage - Attached
Features
- Exterior features: Vinyl, Brick
Lot
- Size: 0.7 Acres
Details
- Parcel number: 09002910004000
Construction
Type & style
- Home type: SingleFamily
- Architectural style: Traditional
Materials
- Roof: Shake / Shingle
Utilities & green energy
- Sewer: Septic
Community & HOA
Location
- Region: Munger
Financial & listing details
- Price per square foot: $85/sqft
- Tax assessed value: $149,000
- Annual tax amount: $2,457
Visit our professional directory to find a foreclosure specialist in your area that can help with your home search.
Find a foreclosure agentForeclosure details
Estimated market value
Not available
Estimated sales range
Not available
$1,381/mo
Price history
Price history
| Date | Event | Price |
|---|---|---|
| 1/16/2026 | Listing removed | $139,000$79/sqft |
Source: | ||
| 12/30/2025 | Price change | $139,000-3.5%$79/sqft |
Source: | ||
| 12/23/2025 | Price change | $144,000-3.4%$82/sqft |
Source: | ||
| 12/11/2025 | Listed for sale | $149,000+103%$85/sqft |
Source: | ||
| 1/18/2020 | Listing removed | -- |
Source: Auction.com Report a problem | ||
| 12/7/2019 | Price change | $73,386-0.2%$42/sqft |
Source: Auction.com Report a problem | ||
| 11/15/2019 | Price change | $73,558-0.2%$42/sqft |
Source: Auction.com Report a problem | ||
| 11/11/2019 | Price change | $73,734+0.1%$42/sqft |
Source: Auction.com Report a problem | ||
| 11/10/2019 | Price change | $73,688-0.3%$42/sqft |
Source: Auction.com Report a problem | ||
| 11/8/2019 | Price change | $73,906+7.2%$42/sqft |
Source: Auction.com Report a problem | ||
| 11/5/2019 | Price change | $68,931-0.4%$39/sqft |
Source: Auction.com Report a problem | ||
| 10/18/2019 | Price change | $69,2150%$39/sqft |
Source: Auction.com Report a problem | ||
| 10/17/2019 | Price change | $69,225+0.2%$39/sqft |
Source: Auction.com Report a problem | ||
| 10/11/2019 | Price change | $69,115-0.1%$39/sqft |
Source: Auction.com Report a problem | ||
| 10/9/2019 | Price change | $69,181+0.1%$39/sqft |
Source: Auction.com Report a problem | ||
| 10/8/2019 | Price change | $69,1270%$39/sqft |
Source: Auction.com Report a problem | ||
| 10/7/2019 | Price change | $69,136+0.3%$39/sqft |
Source: Auction.com Report a problem | ||
| 10/2/2019 | Price change | $68,919-0.3%$39/sqft |
Source: Auction.com Report a problem | ||
| 10/1/2019 | Price change | $69,159-0.1%$39/sqft |
Source: Auction.com Report a problem | ||
| 9/26/2019 | Price change | $69,261+0.3%$40/sqft |
Source: Auction.com Report a problem | ||
| 9/22/2019 | Price change | $69,039+0.1%$39/sqft |
Source: Auction.com Report a problem | ||
| 9/18/2019 | Price change | $69,000-0.1%$39/sqft |
Source: Auction.com Report a problem | ||
| 9/16/2019 | Price change | $69,046-0.1%$39/sqft |
Source: Auction.com Report a problem | ||
| 9/14/2019 | Price change | $69,142+0.2%$39/sqft |
Source: Auction.com Report a problem | ||
| 9/12/2019 | Listed for sale | $69,009-27.4%$39/sqft |
Source: Auction.com Report a problem | ||
| 3/30/2017 | Sold | $95,000$54/sqft |
Source: | ||
Public tax history
Public tax history
| Year | Property taxes | Tax assessment |
|---|---|---|
| 2024 | $2,457 +5.4% | $74,500 +19.3% |
| 2023 | $2,331 +6.8% | $62,450 +1.1% |
| 2022 | $2,182 +1.9% | $61,750 +10.1% |
| 2021 | $2,140 +1.4% | $56,100 +36.2% |
| 2020 | $2,110 +2.7% | $41,200 +2.1% |
| 2019 | $2,054 | $40,350 +3.7% |
| 2018 | $2,054 -4.2% | $38,900 -5% |
| 2017 | $2,143 | $40,950 -6% |
| 2016 | $2,143 | $43,550 +7.5% |
| 2015 | $2,143 | $40,500 -0.9% |
| 2014 | -- | $40,850 +1.7% |
| 2013 | -- | $40,150 +5.1% |
| 2012 | -- | $38,200 -3.2% |
| 2011 | -- | $39,450 -0.3% |
| 2010 | -- | $39,550 -5.6% |
| 2009 | -- | $41,900 -3.2% |
| 2008 | -- | $43,300 -5.9% |
| 2007 | -- | $46,000 +9.8% |
| 2006 | -- | $41,900 -1.6% |
| 2005 | -- | $42,600 +3.9% |
| 2004 | -- | $41,000 +5.4% |
| 2003 | -- | $38,900 +6.6% |
| 2002 | -- | $36,500 +0.8% |
| 2001 | -- | $36,200 |
Find assessor info on the county website
BuyAbility℠ payment
Estimated monthly payment
Boost your down payment with 6% savings match
Earn up to a 6% match & get a competitive APY with a *. Zillow has partnered with to help get you home faster.
Learn more*Terms apply. Match provided by Foyer. Account offered by Pacific West Bank, Member FDIC.Climate risks
Neighborhood: 48747
Nearby schools
GreatSchools rating
- 5/10Hampton Elementary SchoolGrades: PK-5Distance: 6.1 mi
- 3/10Handy Middle SchoolGrades: 6-8Distance: 9.2 mi
- 5/10Bay City Central High SchoolGrades: 9-12Distance: 7.2 mi