$369,500
3 bd|1 ba|1k sqft
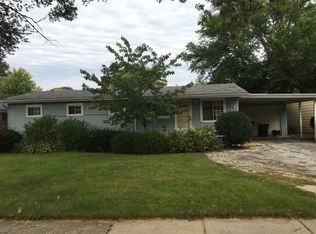
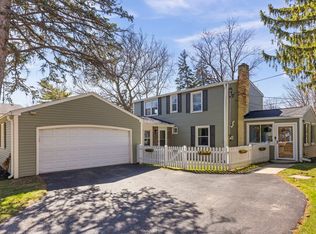
1413 N Wilke Rd, Arlington Heights, IL 60004
Off Market
Likely to sell faster than
Zillow last checked: 7 hours ago
Listing updated: March 31, 2026 at 10:07pm
Bobby Simon 847-903-8246,
Compass
Not available
Estimated sales range
Not available
Not available
| Date | Event | Price |
|---|---|---|
| 3/28/2026 | Listed for sale | $419,000+71.7%$399/sqft |
Source: | ||
| 4/5/2024 | Listing removed | -- |
Source: MRED as distributed by MLS GRID #11972408 Report a problem | ||
| 3/24/2024 | Price change | $2,500-3.8%$2/sqft |
Source: MRED as distributed by MLS GRID #11972408 Report a problem | ||
| 2/23/2024 | Price change | $2,600-3.7%$2/sqft |
Source: MRED as distributed by MLS GRID #11972408 Report a problem | ||
| 2/2/2024 | Listed for rent | $2,700-3.6%$3/sqft |
Source: MRED as distributed by MLS GRID #11972408 Report a problem | ||
| 2/2/2024 | Listing removed | -- |
Source: Zillow Rentals Report a problem | ||
| 1/31/2024 | Price change | $2,800-1.8%$3/sqft |
Source: Zillow Rentals Report a problem | ||
| 1/24/2024 | Price change | $2,850-1.7%$3/sqft |
Source: Zillow Rentals Report a problem | ||
| 1/21/2024 | Listed for rent | $2,900+3.6%$3/sqft |
Source: Zillow Rentals Report a problem | ||
| 8/7/2023 | Sold | $244,000$233/sqft |
Source: Public Record Report a problem | ||
| 8/5/2023 | Listing removed | -- |
Source: MRED as distributed by MLS GRID #MRD11839381 Report a problem | ||
| 7/27/2023 | Price change | $2,800-3.4%$3/sqft |
Source: MRED as distributed by MLS GRID #11839381 Report a problem | ||
| 7/21/2023 | Listed for rent | $2,900-1.7%$3/sqft |
Source: MRED as distributed by MLS GRID #11839381 Report a problem | ||
| 7/20/2023 | Listing removed | -- |
Source: Zillow Rentals Report a problem | ||
| 7/10/2023 | Listed for rent | $2,950$3/sqft |
Source: Zillow Rentals Report a problem | ||
| Year | Property taxes | Tax assessment |
|---|---|---|
| 2023 | $6,579 +149.4% | $29,999 |
| 2022 | $2,638 -10% | $29,999 +30.9% |
| 2021 | $2,933 +10.2% | $22,909 |
| 2020 | $2,661 +1% | $22,909 -10.2% |
| 2019 | $2,634 -38.4% | $25,512 +18.5% |
| 2018 | $4,275 +45.1% | $21,521 |
| 2017 | $2,945 -15.3% | $21,521 |
| 2016 | $3,479 -10.8% | $21,521 +21.5% |
| 2015 | $3,901 +170.2% | $17,708 |
| 2014 | $1,444 -63.2% | $17,708 -4.6% |
| 2013 | $3,929 +209.7% | $18,567 -20.3% |
| 2012 | $1,269 -3.2% | $23,294 |
| 2011 | $1,310 +11.5% | $23,294 |
| 2010 | $1,175 +11.5% | $23,294 -17.2% |
| 2009 | $1,053 -5.7% | $28,142 -7% |
| 2008 | $1,117 -9.3% | $30,261 |
| 2007 | $1,232 -11.3% | $30,261 +32% |
| 2006 | $1,389 -0.8% | $22,932 |
| 2005 | $1,401 -51.1% | $22,932 |
| 2004 | $2,865 +73.8% | $22,932 +37.3% |
| 2003 | $1,648 +3.6% | $16,706 |
| 2002 | $1,591 -37.2% | $16,706 |
| 2001 | $2,534 +1.5% | $16,706 +16.9% |
| 2000 | $2,496 | $14,292 |
| 1999 | -- | $14,292 |
Find assessor info on the county website
Source: MRED as distributed by MLS GRID. This data may not be complete. We recommend contacting the local school district to confirm school assignments for this home.