$344,200
-- bd|-- ba|-- sqft
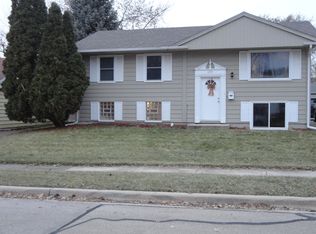
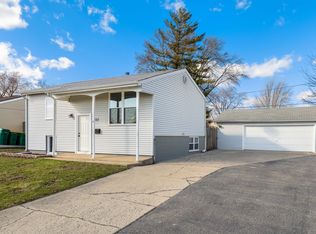
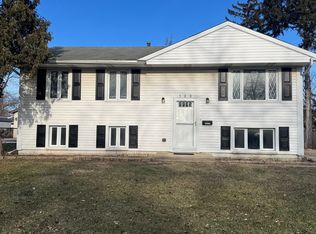
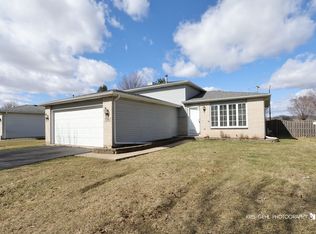
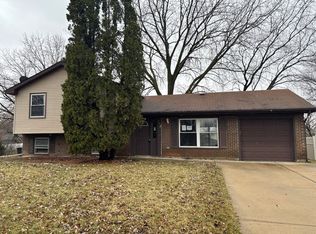
137 Ambassador Ave, Romeoville, IL 60446
Off Market
Likely to sell faster than
Zillow last checked: 7 hours ago
Listing updated: March 17, 2026 at 08:14am
Tom Kozma 815-405-6950,
Baird & Warner
Not available
Estimated sales range
Not available
Not available
| Date | Event | Price |
|---|---|---|
| 3/17/2026 | Listed for sale | $316,000+125.7%$175/sqft |
Source: | ||
| 7/10/2015 | Sold | $140,000$77/sqft |
Source: | ||
| 6/13/2015 | Pending sale | $140,000$77/sqft |
Source: RE/MAX Vision 212 #08767220 Report a problem | ||
| 6/11/2015 | Price change | $140,000-4.1%$77/sqft |
Source: RE/MAX Vision 212 #08767220 Report a problem | ||
| 4/8/2015 | Pending sale | $146,000$81/sqft |
Source: RE/MAX Vision 212 #08767220 Report a problem | ||
| 3/26/2015 | Price change | $146,000+28.1%$81/sqft |
Source: Remax Vision #08767220 Report a problem | ||
| 2/21/2015 | Pending sale | $114,000$63/sqft |
Source: Remax Vision #08767220 Report a problem | ||
| 1/10/2015 | Price change | $114,000-8.1%$63/sqft |
Source: Remax Vision #08767220 Report a problem | ||
| 12/16/2014 | Price change | $124,000-7.5%$69/sqft |
Source: Remax Vision #08767220 Report a problem | ||
| 11/17/2014 | Price change | $134,000-13%$74/sqft |
Source: Remax Vision #08767220 Report a problem | ||
| 11/4/2014 | Listed for sale | $154,000-13.5%$85/sqft |
Source: Remax Vision #08767220 Report a problem | ||
| 8/18/2005 | Sold | $178,000+36.9%$98/sqft |
Source: Public Record Report a problem | ||
| 7/17/2001 | Sold | $130,000$72/sqft |
Source: Public Record Report a problem | ||
| Year | Property taxes | Tax assessment |
|---|---|---|
| 2023 | $6,030 +9.6% | $73,319 +13.7% |
| 2022 | $5,504 +5.5% | $64,489 +7% |
| 2021 | $5,214 +3% | $60,298 +3.4% |
| 2020 | $5,063 +6.5% | $58,315 +7.1% |
| 2019 | $4,753 +8.3% | $54,449 +8.7% |
| 2018 | $4,387 +6.2% | $50,095 +5.5% |
| 2017 | $4,131 +4.4% | $47,483 +5.1% |
| 2016 | $3,958 +5.3% | $45,200 +4.4% |
| 2015 | $3,758 | $43,300 +3.8% |
| 2014 | $3,758 -2.3% | $41,700 -5% |
| 2013 | $3,845 +4.3% | $43,900 -3.1% |
| 2012 | $3,687 +6% | $45,300 -5% |
| 2011 | $3,477 -1% | $47,700 -10% |
| 2010 | $3,511 +6.1% | $53,000 |
| 2009 | $3,309 -9.7% | $53,000 -13% |
| 2008 | $3,666 | $60,900 +4.1% |
| 2007 | -- | $58,500 +5% |
| 2006 | $3,567 +6.2% | $55,700 +9.9% |
| 2005 | $3,359 +23% | $50,700 +19.9% |
| 2004 | $2,730 +2.6% | $42,300 +4.7% |
| 2003 | $2,662 +11% | $40,400 +15.1% |
| 2002 | $2,398 -4.7% | $35,100 |
| 2001 | $2,517 +21.8% | $35,100 +14.3% |
| 2000 | $2,066 | $30,700 |
Find assessor info on the county website
Source: MRED as distributed by MLS GRID. This data may not be complete. We recommend contacting the local school district to confirm school assignments for this home.