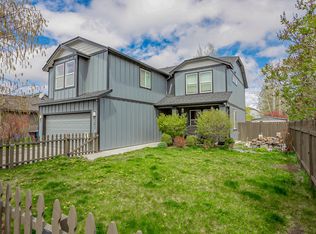
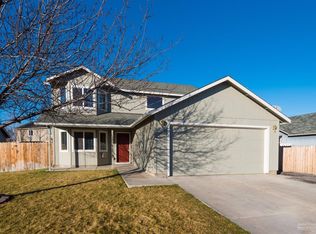
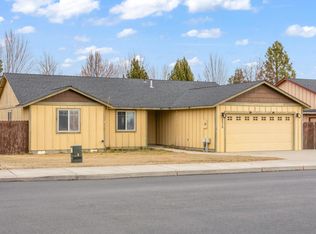
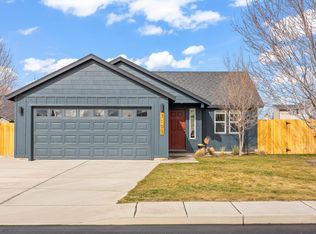
Don't miss your chance at this spacious 2016 Sq.Ft. 4 br 2.5 bath home. It is neat as a pin and in a quite neighborhood. At this price it will not last long so don't delay!!
Pre-foreclosure
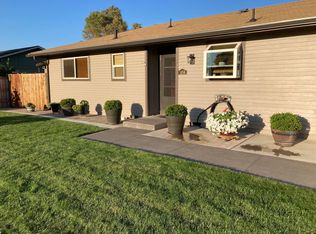
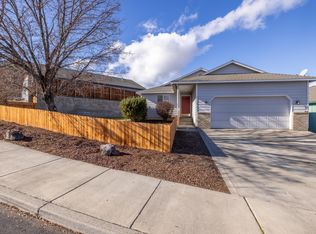
Street View
Est. $459,300
1343 SW 33rd St, Redmond, OR 97756
4beds
2baths
2,015sqft
SingleFamily
Built in 1999
6,098 Square Feet Lot
$459,300 Zestimate®
$228/sqft
$-- HOA
Overview
- 17 days |
- 15 |
- 0 |
Facts & features
Interior
Bedrooms & bathrooms
- Bedrooms: 4
- Bathrooms: 2.5
Interior area
- Total interior livable area: 2,015 sqft
Property
Parking
- Parking features: Garage - Attached
Lot
- Size: 6,098 Square Feet
Details
- Parcel number: 151317CC04700
Construction
Type & style
- Home type: SingleFamily
Condition
- Year built: 1999
Community & HOA
Location
- Region: Redmond
Financial & listing details
- Price per square foot: $228/sqft
- Tax assessed value: $480,130
- Annual tax amount: $4,266
Visit our professional directory to find a foreclosure specialist in your area that can help with your home search.
Find a foreclosure agentForeclosure details
Estimated market value
$459,300
$427,000 - $487,000
$2,580/mo
Price history
Price history
| Date | Event | Price |
|---|---|---|
| 7/29/2011 | Sold | $129,000+3.2%$64/sqft |
Source: Public Record Report a problem | ||
| 6/3/2011 | Price change | $125,000-3.8%$62/sqft |
Source: Listhub #201101742 Report a problem | ||
| 3/13/2011 | Listed for sale | $129,900-40.1%$64/sqft |
Source: Listhub #201101742 Report a problem | ||
| 4/17/2008 | Sold | $217,000-0.9%$108/sqft |
Source: Public Record Report a problem | ||
| 2/16/2008 | Listed for sale | $219,000$109/sqft |
Source: NCI #2800070 Report a problem | ||
Public tax history
Public tax history
| Year | Property taxes | Tax assessment |
|---|---|---|
| 2025 | $4,266 +4.2% | $209,230 +3% |
| 2024 | $4,093 +4.6% | $203,140 +6.1% |
| 2023 | $3,914 +6.7% | $191,490 |
| 2022 | $3,669 +6.6% | $191,490 +6.1% |
| 2021 | $3,441 | $180,510 |
| 2020 | -- | $180,510 +6.1% |
| 2019 | $3,142 | $170,160 |
| 2018 | $3,142 +2.6% | $170,160 +3% |
| 2017 | $3,064 +3.9% | $165,210 +3% |
| 2016 | $2,950 | $160,400 +3% |
| 2015 | $2,950 +5.9% | $155,730 +3% |
| 2014 | $2,784 | $151,200 +6% |
| 2013 | -- | $142,650 +35% |
| 2012 | -- | $105,660 -22.2% |
| 2011 | -- | $135,750 -0.7% |
| 2010 | -- | $136,650 -6.9% |
| 2009 | -- | $146,800 +3% |
| 2008 | -- | $142,530 +3% |
| 2007 | -- | $138,380 +3% |
| 2006 | -- | $134,350 +3% |
| 2005 | -- | $130,440 +6.1% |
| 2003 | -- | $122,964 -17.8% |
| 2002 | -- | $149,675 +11% |
| 2001 | -- | $134,865 -0.9% |
| 2000 | -- | $136,090 |
Find assessor info on the county website
BuyAbility℠ payment
Estimated monthly payment
Boost your down payment with 6% savings match
Earn up to a 6% match & get a competitive APY with a *. Zillow has partnered with to help get you home faster.
Learn more*Terms apply. Match provided by Foyer. Account offered by Pacific West Bank, Member FDIC.Climate risks
Neighborhood: 97756
Nearby schools
GreatSchools rating
- 7/10Vern Patrick Elementary SchoolGrades: K-5Distance: 0.2 mi
- 5/10Obsidian Middle SchoolGrades: 6-8Distance: 1.2 mi
- 7/10Ridgeview High SchoolGrades: 9-12Distance: 2 mi