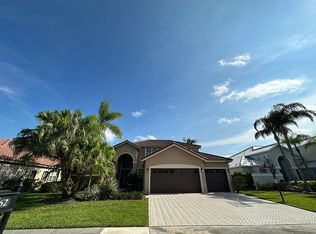
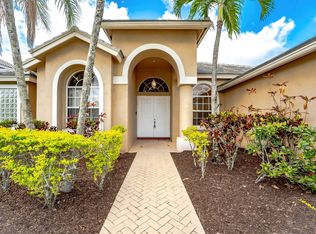
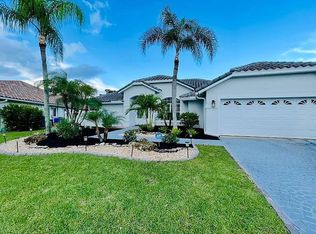
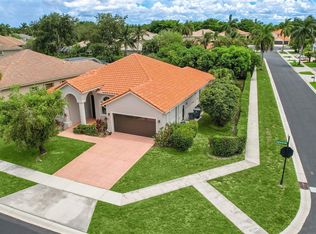
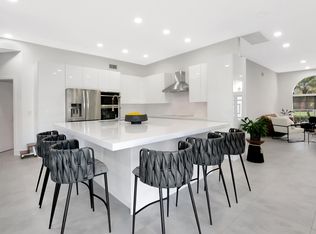
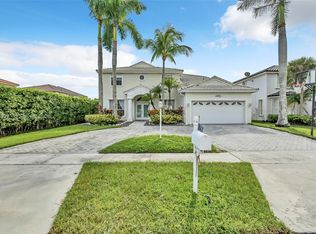
Beautiful 1 floor home located in Boca Falls gated community. Community amenities include club house, tennis courts, basketball courts, pool and fully equipped gym. Home features include private fenced in pool in back yard with natural rock faced stone jacuzzi with waterfall. 4 bedroom, 3 bath home, with formal dining room, family room and living room. 20 minutes to the ocean. Schools in immediate walking distance from the home.
Pre-foreclosure
Est. $986,900
12646 Torbay Dr, Boca Raton, FL 33428
4beds
2,730sqft
SingleFamily
Built in 1996
10,158 Square Feet Lot
$986,900 Zestimate®
$362/sqft
$315/mo HOA
Overview
- 148 days |
- 78 |
- 9 |
Facts & features
Interior
Bedrooms & bathrooms
- Bedrooms: 4
- Bathrooms: 3
- Full bathrooms: 3
Heating
- Forced air
Cooling
- Central
Appliances
- Included: Dishwasher, Dryer, Microwave, Refrigerator, Washer
Features
- Ctdrl/Vault Ceilings, Foyer, Pantry, Split Bedroom, W/D Hookup, Walk-in Closet
- Flooring: Tile, Carpet, Hardwood
Interior area
- Total interior livable area: 2,730 sqft
Property
Parking
- Parking features: Garage - Attached
Features
- Exterior features: Stucco
- Has spa: Yes
- Has view: Yes
- View description: Water
- Has water view: Yes
- Water view: Water
Lot
- Size: 10,158 Square Feet
Details
- Parcel number: 00414722110000180
Construction
Type & style
- Home type: SingleFamily
Materials
- masonry
- Roof: Tile
Condition
- Year built: 1996
Community & HOA
Community
- Features: On Site Laundry Available
HOA
- Has HOA: Yes
- HOA fee: $315 monthly
Location
- Region: Boca Raton
Financial & listing details
- Price per square foot: $362/sqft
- Tax assessed value: $748,347
- Annual tax amount: $7,576
Visit our professional directory to find a foreclosure specialist in your area that can help with your home search.
Find a foreclosure agentForeclosure details
Estimated market value
$986,900
$918,000 - $1.07M
$6,743/mo
Price history
Price history
| Date | Event | Price |
|---|---|---|
| 2/28/2017 | Sold | $510,000-2.9%$187/sqft |
Source: | ||
| 12/29/2016 | Pending sale | $525,000$192/sqft |
Source: ListWithFreedom.com, Inc. #RX-10258552 Report a problem | ||
| 7/27/2016 | Listed for sale | $525,000-1.9%$192/sqft |
Source: Owner Report a problem | ||
| 4/5/2015 | Listing removed | $3,500$1/sqft |
Source: Linda Tomasso Report a problem | ||
| 3/6/2015 | Listed for rent | $3,500$1/sqft |
Source: Linda Tomasso Report a problem | ||
| 8/3/2004 | Sold | $535,000+25.1%$196/sqft |
Source: Public Record Report a problem | ||
| 7/31/2002 | Sold | $427,500+56.9%$157/sqft |
Source: Public Record Report a problem | ||
| 12/8/1997 | Sold | $272,500+10.4%$100/sqft |
Source: Public Record Report a problem | ||
| 10/1/1996 | Sold | $246,900-24.1%$90/sqft |
Source: Public Record Report a problem | ||
| 12/6/1995 | Sold | $325,100$119/sqft |
Source: Public Record Report a problem | ||
Public tax history
Public tax history
| Year | Property taxes | Tax assessment |
|---|---|---|
| 2024 | $7,576 +2.4% | $481,317 +3% |
| 2023 | $7,395 +0.8% | $467,298 +3% |
| 2022 | $7,338 +0.4% | $453,687 +3% |
| 2021 | $7,307 +0.6% | $440,473 +1.4% |
| 2020 | $7,260 +1.2% | $434,392 +2.3% |
| 2019 | $7,175 | $424,626 -3% |
| 2018 | $7,175 -8.9% | $437,644 +1.2% |
| 2017 | $7,876 -0.1% | $432,384 +3.7% |
| 2016 | $7,883 +1% | $416,807 +0.8% |
| 2015 | $7,809 -2.4% | $413,417 +3.8% |
| 2014 | $7,999 +6.6% | $398,448 +4.5% |
| 2013 | $7,507 -1.1% | $381,356 +0.6% |
| 2012 | $7,592 +12.7% | $378,965 +3.4% |
| 2011 | $6,733 +0.4% | $366,655 +1.5% |
| 2010 | $6,706 -8.3% | $361,236 -11.2% |
| 2009 | $7,315 -2.5% | $406,853 -12.4% |
| 2008 | $7,506 -11.7% | $464,513 -10% |
| 2007 | $8,500 -16.6% | $516,176 -9% |
| 2006 | $10,188 | $566,991 +30% |
| 2005 | -- | $436,025 +23.8% |
| 2004 | $3,656 +1608.3% | $352,324 +6.6% |
| 2003 | $214 -96.6% | $330,642 +5.7% |
| 2002 | $6,341 +10.3% | $312,698 +12.1% |
| 2001 | $5,746 +15.4% | $278,902 +14.4% |
| 2000 | $4,980 +7.8% | $243,860 +3% |
| 1999 | $4,621 | $236,842 |
Find assessor info on the county website
BuyAbility℠ payment
Estimated monthly payment
All calculations are estimates and provided by Zillow, Inc. for informational purposes only. Actual amounts may vary.
HOA fees may include property taxes on listings classified as Co-Ops. Contact the listing agent and/or owner for fee details.
Mortgage interest rates are dependent on a number of factors, including credit score, down payment, and repayment length. Interest rate data provided by Zillow Group Marketplace, Inc. as of 1/1/1970 from various mortgage lenders with which we have lead or other similar arrangements; the Estimated Payment is an average of those rates.
See how much you could borrow to make a competitive offer.
Boost your down payment with 6% savings match
Earn up to a 6% match & get a competitive APY with a *. Zillow has partnered with to help get you home faster.
Learn more*Terms apply. Match provided by Foyer. Account offered by Pacific West Bank, Member FDIC.Climate risks
Neighborhood: Boca Falls
Getting around
0 / 100
No Nearby TransitNearby schools
GreatSchools rating
- 10/10Waters Edge Elementary SchoolGrades: PK-5Distance: 0.3 mi
- 9/10Loggers' Run Community Middle SchoolGrades: 6-8Distance: 1 mi
- 7/10West Boca Raton High SchoolGrades: 9-12Distance: 0.6 mi


- Florida
- Palm Beach County
- Boca Raton
- 33428
- Boca Falls
- 12646 Torbay Dr
Nearby cities
Nearby neighborhoods
Nearby zip codes
Other Boca Raton Topics
