$--
2 bd|1 ba|-- sqft
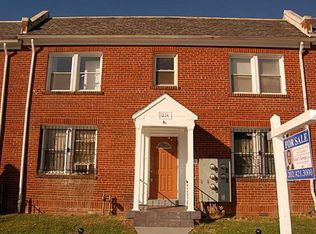
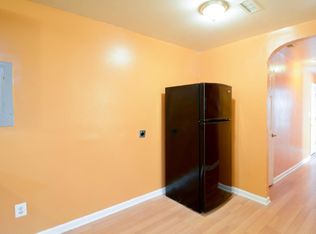
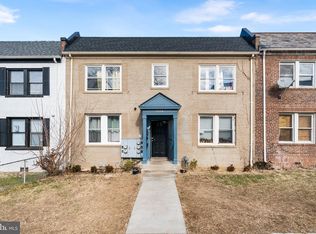
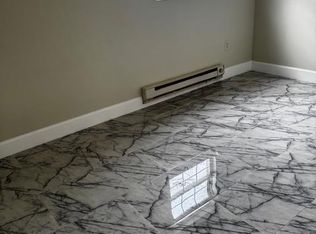
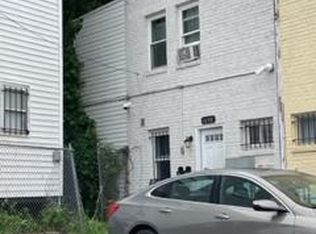
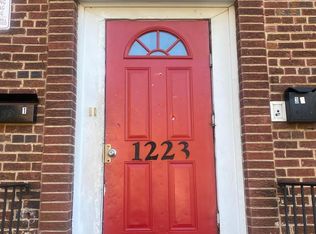
1214 18th Pl NE APT 2, Washington, DC 20002
Off Market

Zillow last checked: 7 hours ago
Listing updated: February 26, 2026 at 07:14am
Christina La Vigna 631-365-5862,
Halcyon Realty Group LLC
Not available
Estimated sales range
Not available
$3,380/mo
| Date | Event | Price |
|---|---|---|
| 2/26/2026 | Listed for sale | $1,000,000+2%$377/sqft |
Source: | ||
| 1/22/2026 | Listing removed | $980,000$370/sqft |
Source: | ||
| 10/24/2025 | Contingent | $980,000$370/sqft |
Source: | ||
| 9/3/2025 | Listed for sale | $980,000-27.4%$370/sqft |
Source: | ||
| 8/28/2025 | Listing removed | $1,349,000$509/sqft |
Source: | ||
| 8/8/2025 | Listed for sale | $1,349,000+60.6%$509/sqft |
Source: | ||
| 4/12/2021 | Sold | $840,000-13.8%$317/sqft |
Source: Public Record Report a problem | ||
| 2/19/2021 | Listed for sale | $975,000$368/sqft |
Source: Owner Report a problem | ||
| 12/24/2020 | Listing removed | $975,000$368/sqft |
Source: Power 1 Realty and Design Group #DCDC493568 Report a problem | ||
| 12/1/2020 | Price change | $975,000-18.8%$368/sqft |
Source: Power 1 Realty and Design Group #DCDC493568 Report a problem | ||
| 10/23/2020 | Listed for sale | $1,200,000+33.3%$452/sqft |
Source: Power 1 Realty and Design Group #DCDC493568 Report a problem | ||
| 8/13/2020 | Listing removed | $899,900$339/sqft |
Source: Owner Report a problem | ||
| 3/22/2020 | Listed for sale | $899,900+282.9%$339/sqft |
Source: Owner Report a problem | ||
| 11/5/2019 | Listing removed | $1,709$1/sqft |
Source: Zillow Rental Manager Report a problem | ||
| 10/6/2019 | Listed for rent | $1,709$1/sqft |
Source: Zillow Rental Manager Report a problem | ||
| 12/19/2003 | Sold | $235,000+88%$89/sqft |
Source: Public Record Report a problem | ||
| 4/12/2002 | Sold | $125,000+115.5%$47/sqft |
Source: Public Record Report a problem | ||
| 9/21/2001 | Sold | $58,000$22/sqft |
Source: Public Record Report a problem | ||
| Year | Property taxes | Tax assessment |
|---|---|---|
| 2025 | $46,762 -2.4% | $935,240 -2.4% |
| 2024 | $47,934 +519.1% | $958,680 +5.2% |
| 2023 | $7,742 +3.4% | $910,870 +3.4% |
| 2022 | $7,490 +10.7% | $881,180 +10.7% |
| 2021 | $6,763 +8.3% | $795,700 +8.3% |
| 2020 | $6,243 +27.4% | $734,510 +27.4% |
| 2018 | $4,900 +5.1% | $576,470 +5.1% |
| 2017 | $4,663 +14.3% | $548,560 +14.3% |
| 2016 | $4,078 +17.5% | $479,750 +17.5% |
| 2015 | $3,471 +30% | $408,360 +30% |
| 2014 | $2,669 +8.3% | $314,020 +8.3% |
| 2013 | $2,465 -13.9% | $289,950 -13.9% |
| 2012 | $2,863 | $336,800 |
| 2011 | $2,863 -19.3% | $336,800 -19.3% |
| 2010 | $3,547 -4.3% | $417,250 -4.3% |
| 2009 | $3,705 +16.8% | $435,860 +21% |
| 2007 | $3,171 +42.2% | $360,320 +48.7% |
| 2006 | $2,229 -6% | $242,290 -1.9% |
| 2005 | $2,371 +114.5% | $247,000 +157% |
| 2001 | $1,105 | $96,114 |
Find assessor info on the county website
Source: Bright MLS. This data may not be complete. We recommend contacting the local school district to confirm school assignments for this home.