$194,100
4 bd|2 ba|1.1k sqft
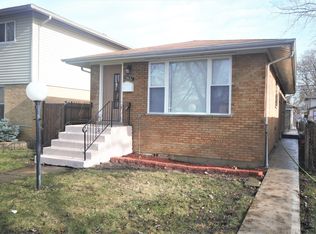
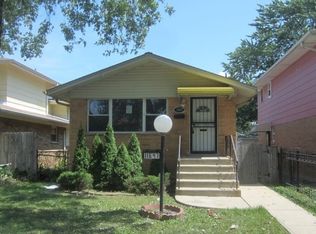
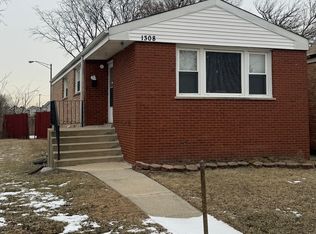
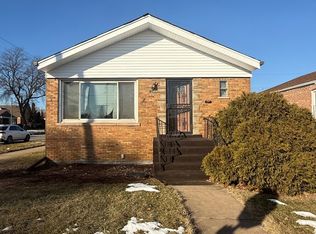
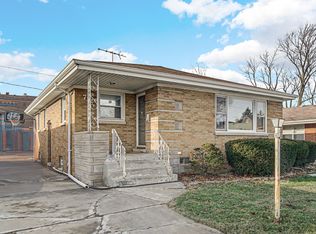
11637 S Loomis St, Chicago, IL 60643
Off Market
Zillow last checked: 7 hours ago
Listing updated: March 09, 2026 at 08:12am
Jimish Desai 630-890-6494,
Exit Strategy Realty
$164,200
$126,000 - $200,000
$2,335/mo
| Date | Event | Price |
|---|---|---|
| 3/9/2026 | Listed for sale | $149,900-0.1%$115/sqft |
Source: | ||
| 11/2/2023 | Listing removed | -- |
Source: | ||
| 10/28/2023 | Contingent | $150,000$115/sqft |
Source: | ||
| 10/22/2023 | Listed for sale | $150,000$115/sqft |
Source: | ||
| 10/20/2023 | Contingent | $150,000$115/sqft |
Source: | ||
| 10/17/2023 | Listed for sale | $150,000+275%$115/sqft |
Source: | ||
| 6/7/2017 | Sold | $40,000-6.8%$31/sqft |
Source: | ||
| 5/9/2017 | Pending sale | $42,900$33/sqft |
Source: RLB Realty Group Inc. #09583831 Report a problem | ||
| 5/7/2017 | Price change | $42,900-14%$33/sqft |
Source: RLB Realty Group Inc. #09583831 Report a problem | ||
| 4/4/2017 | Listed for sale | $49,900-30.7%$38/sqft |
Source: RLB Realty Group Inc. #09583831 Report a problem | ||
| 12/8/2016 | Listing removed | -- |
Source: Auction.com Report a problem | ||
| 11/6/2016 | Listed for sale | -- |
Source: Auction.com Report a problem | ||
| 4/17/2008 | Sold | $72,000$55/sqft |
Source: | ||
| Year | Property taxes | Tax assessment |
|---|---|---|
| 2023 | $2,750 +2.5% | $13,000 |
| 2022 | $2,682 +2.3% | $13,000 |
| 2021 | $2,622 +64.2% | $13,000 +81.8% |
| 2020 | $1,596 -0.2% | $7,149 -10% |
| 2019 | $1,600 +1.7% | $7,944 |
| 2018 | $1,573 -43.9% | $7,944 -38.9% |
| 2017 | $2,806 +7.5% | $13,004 |
| 2016 | $2,611 +9.3% | $13,004 |
| 2015 | $2,389 +16.4% | $13,004 +17.8% |
| 2014 | $2,053 +2% | $11,036 |
| 2013 | $2,012 +1.4% | $11,036 |
| 2012 | $1,985 -4.8% | $11,036 -14.1% |
| 2011 | $2,086 -0.4% | $12,844 |
| 2010 | $2,094 +4.4% | $12,844 |
| 2009 | $2,007 +0.5% | $12,844 -7.6% |
| 2008 | $1,997 +1.1% | $13,897 |
| 2007 | $1,976 -1.1% | $13,897 |
| 2006 | $1,998 +28.1% | $13,897 +45.9% |
| 2005 | $1,559 +1% | $9,526 |
| 2004 | $1,544 +2.2% | $9,526 |
| 2003 | $1,510 +5.6% | $9,526 +19.8% |
| 2002 | $1,431 +3.7% | $7,952 |
| 2001 | $1,379 +1.6% | $7,952 |
| 2000 | $1,358 -0.7% | $7,952 +12.7% |
| 1999 | $1,367 | $7,057 |
Find assessor info on the county website
Source: MRED as distributed by MLS GRID. This data may not be complete. We recommend contacting the local school district to confirm school assignments for this home.