$985,600
4 bd|2 ba|2.1k sqft
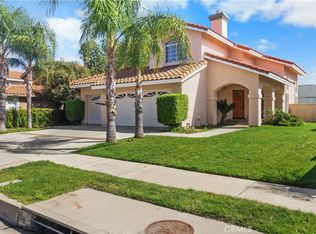
11228 Skyview Ln, Rancho Cucamonga, CA 91737
Off Market
Likely to sell faster than
Zillow last checked: 7 hours ago
Listing updated: April 02, 2026 at 08:45pm
YUNQING LI DRE #01917801 626-636-0009,
RE/MAX MASTERS
$964,600
$916,000 - $1.01M
$4,030/mo
| Date | Event | Price |
|---|---|---|
| 4/3/2026 | Contingent | $969,000$350/sqft |
Source: | ||
| 1/31/2026 | Listed for sale | $969,000+73%$350/sqft |
Source: | ||
| 12/15/2019 | Listing removed | $2,800$1/sqft |
Source: RE/MAX MASTERS #WS19280226 Report a problem | ||
| 12/13/2019 | Listed for rent | $2,800+7.7%$1/sqft |
Source: RE/MAX Masters Realty #WS19280226 Report a problem | ||
| 10/26/2016 | Listing removed | $2,600+18.2%$1/sqft |
Source: RE/MAX MASTERS #WS16731882 Report a problem | ||
| 10/12/2013 | Listing removed | $2,200$1/sqft |
Source: COLDWELL BANKER DYNASTY/TC #WS13200371 Report a problem | ||
| 10/3/2013 | Listed for rent | $2,200$1/sqft |
Source: COLDWELL BANKER DYNASTY/TC #WS13200371 Report a problem | ||
| 8/14/2013 | Sold | $560,000+6.7%$203/sqft |
Source: Public Record Report a problem | ||
| 7/6/2013 | Listed for sale | $525,000+122%$190/sqft |
Source: TARBELL REALTORS-UPLAND #CV13130612 Report a problem | ||
| 2/28/1997 | Sold | $236,500+18.4%$86/sqft |
Source: Public Record Report a problem | ||
| 1/15/1997 | Sold | $199,750$72/sqft |
Source: Public Record Report a problem | ||
| Year | Property taxes | Tax assessment |
|---|---|---|
| 2025 | $8,049 +2.6% | $686,484 +2% |
| 2024 | $7,847 +2.3% | $673,024 +2% |
| 2023 | $7,669 +0.4% | $659,828 +2% |
| 2022 | $7,640 +0.2% | $646,891 +2% |
| 2021 | $7,628 +4.2% | $634,207 +1% |
| 2020 | $7,322 -0.9% | $627,704 +2% |
| 2019 | $7,392 +2.1% | $615,396 +2% |
| 2018 | $7,238 +4.9% | $603,329 +2% |
| 2017 | $6,902 | $591,499 +2% |
| 2016 | $6,902 +2.8% | $579,900 +1.5% |
| 2015 | $6,716 +0.7% | $571,189 +2% |
| 2014 | $6,668 | $560,000 +45.3% |
| 2013 | -- | $385,333 +2% |
| 2012 | -- | $377,777 +2% |
| 2011 | -- | $370,369 +0.8% |
| 2010 | -- | $367,601 -0.2% |
| 2009 | -- | $368,474 +2% |
| 2008 | -- | $361,249 +2% |
| 2007 | -- | $354,166 +2% |
| 2006 | -- | $347,221 +2% |
| 2005 | -- | $340,413 +2% |
| 2004 | -- | $333,738 +1.9% |
| 2003 | -- | $327,621 +2% |
| 2002 | -- | $321,197 +8.1% |
| 2001 | -- | $297,000 +8.6% |
| 2000 | -- | $273,400 |
Find assessor info on the county website
Source: CRMLS. This data may not be complete. We recommend contacting the local school district to confirm school assignments for this home.