$--
2 bd|1 ba|1.2k sqft
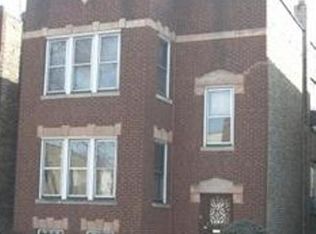
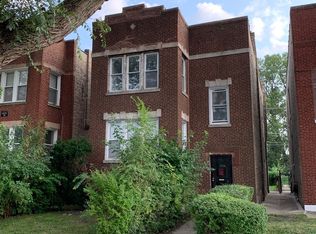
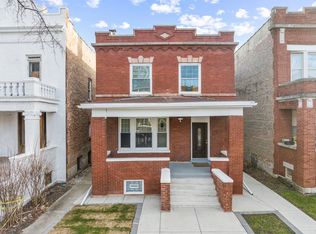
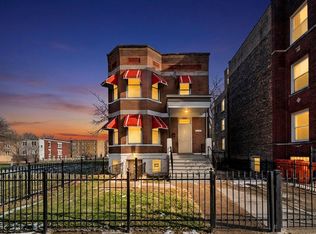
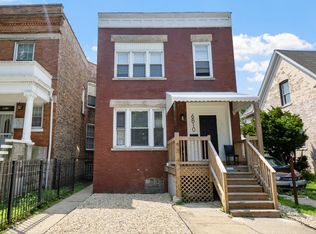
111 W 74th St #2, Chicago, IL 60621
Off Market
Zillow last checked: 7 hours ago
Listing updated: March 07, 2026 at 10:09pm
Da'Mon Wardlow 312-939-5253,
Kale Realty,
Ebony Reaves,
Kale Realty
Not available
Estimated sales range
Not available
Not available
| Date | Event | Price |
|---|---|---|
| 3/2/2026 | Listed for sale | $410,000+2.8% |
Source: | ||
| 3/19/2025 | Listing removed | $398,900 |
Source: | ||
| 12/7/2024 | Listed for sale | $398,900 |
Source: | ||
| 11/23/2024 | Listing removed | $398,900 |
Source: | ||
| 11/17/2024 | Listed for sale | $398,900+14% |
Source: | ||
| 2/23/2024 | Listing removed | -- |
Source: | ||
| 12/16/2023 | Contingent | $350,000 |
Source: | ||
| 12/7/2023 | Listed for sale | $350,000+2.7% |
Source: | ||
| 10/19/2023 | Listing removed | -- |
Source: | ||
| 7/31/2023 | Listed for sale | $340,900+37.5% |
Source: | ||
| 6/22/2019 | Sold | $248,000+3.3% |
Source: | ||
| 4/12/2019 | Pending sale | $240,000 |
Source: Select a Fee RE System #10333541 Report a problem | ||
| 4/5/2019 | Listed for sale | $240,000+431% |
Source: Select a Fee RE System #10333541 Report a problem | ||
| 6/18/2018 | Sold | $45,200+6.4% |
Source: | ||
| 5/21/2018 | Pending sale | $42,500 |
Source: The Chicagoland RE Auction Co. #09952594 Report a problem | ||
| 5/16/2018 | Listed for sale | $42,500+11.8% |
Source: The Chicagoland RE Auction Co. #09952594 Report a problem | ||
| 6/22/2012 | Listing removed | $38,000 |
Source: foreclosure.com Report a problem | ||
| 5/26/2012 | Listed for sale | $38,000 |
Source: foreclosure.com Report a problem | ||
| Year | Property taxes | Tax assessment |
|---|---|---|
| 2023 | $3,587 +2.6% | $16,999 |
| 2022 | $3,496 +2.3% | $16,999 |
| 2021 | $3,418 -5.3% | $16,999 +4.9% |
| 2020 | $3,609 -0.2% | $16,200 -10% |
| 2019 | $3,616 +25.7% | $18,000 |
| 2018 | $2,877 -6.6% | $18,000 +1.8% |
| 2017 | $3,080 +1.3% | $17,683 |
| 2016 | $3,042 +10.2% | $17,683 |
| 2015 | $2,760 +4.4% | $17,683 +5.1% |
| 2014 | $2,644 +2.5% | $16,821 |
| 2013 | $2,581 +0.4% | $16,821 |
| 2012 | $2,571 -3.3% | $16,821 -12.9% |
| 2011 | $2,659 +13% | $19,312 |
| 2010 | $2,354 +12.8% | $19,312 |
| 2009 | $2,086 +8.9% | $19,312 +2.3% |
| 2008 | $1,916 +3.2% | $18,876 |
| 2007 | $1,857 +0.8% | $18,876 |
| 2006 | $1,843 -5.1% | $18,876 +29.6% |
| 2005 | $1,943 +1.9% | $14,568 |
| 2004 | $1,906 -17.3% | $14,568 |
| 2003 | $2,305 +2.1% | $14,568 +16% |
| 2002 | $2,257 +3.7% | $12,562 |
| 2001 | $2,175 +14.4% | $12,562 |
| 2000 | $1,901 -0.7% | $12,562 +26.9% |
| 1999 | $1,914 | $9,898 |
Find assessor info on the county website
Source: MRED as distributed by MLS GRID. This data may not be complete. We recommend contacting the local school district to confirm school assignments for this home.