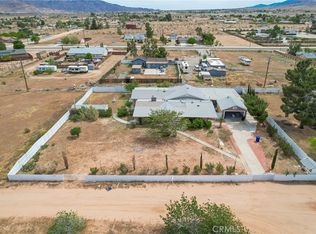
This 2516 square foot single family home has 5 bedrooms and 2.0 bathrooms. This home is located at 10921 Mohawk Rd, Apple Valley, CA 92308.
Pre-foreclosure
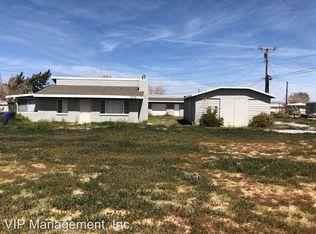
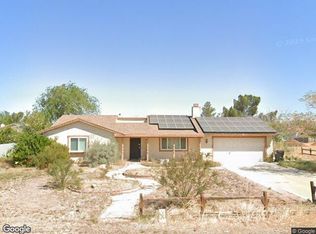
Street View
Est. $454,700
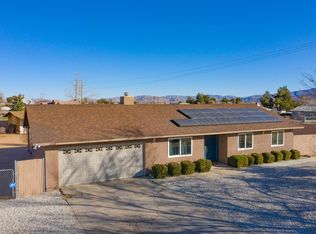
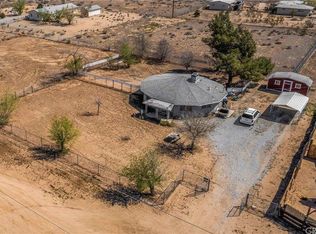
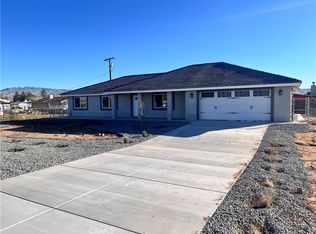
10921 Mohawk Rd, Apple Valley, CA 92308
5beds
2,516sqft
SingleFamily
Built in 1956
0.64 Acres Lot
$454,700 Zestimate®
$181/sqft
$-- HOA
Overview
- 317 days |
- 31 |
- 0 |
Facts & features
Interior
Bedrooms & bathrooms
- Bedrooms: 5
- Bathrooms: 2
- Full bathrooms: 2
Heating
- Other, Gas
Cooling
- Central
Appliances
- Included: Dishwasher, Microwave, Range / Oven
Features
- Flooring: Tile, Linoleum / Vinyl
- Has fireplace: Yes
Interior area
- Total interior livable area: 2,516 sqft
Property
Parking
- Total spaces: 2
- Parking features: Garage - Detached
Features
- Exterior features: Stucco
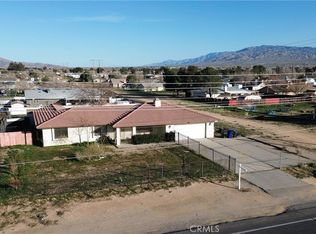
- Has view: Yes
- View description: Mountain
Lot
- Size: 0.64 Acres
Details
- Parcel number: 0434461480000
Construction
Type & style
- Home type: SingleFamily
Materials
- masonry
- Roof: Composition
Condition
- Year built: 1956
Community & HOA
Location
- Region: Apple Valley
Financial & listing details
- Price per square foot: $181/sqft
- Tax assessed value: $340,232
- Annual tax amount: $4,513
Visit our professional directory to find a foreclosure specialist in your area that can help with your home search.
Find a foreclosure agentForeclosure details
Estimated market value
$454,700
$427,000 - $482,000
$2,945/mo
Price history
Price history
| Date | Event | Price |
|---|---|---|
| 5/8/2019 | Sold | $305,000-2.2%$121/sqft |
Source: Public Record Report a problem | ||
| 3/30/2019 | Pending sale | $312,000$124/sqft |
Source: CENTURY 21 Desert Rock #506643 Report a problem | ||
| 3/25/2019 | Price change | $312,000+1.3%$124/sqft |
Source: CENTURY 21 Desert Rock #506643 Report a problem | ||
| 3/11/2019 | Price change | $308,000+2.7%$122/sqft |
Source: CENTURY 21 Desert Rock #506643 Report a problem | ||
| 1/8/2019 | Price change | $299,900-1.7%$119/sqft |
Source: CENTURY 21 Desert Rock #506643 Report a problem | ||
| 12/18/2018 | Price change | $305,000-2.2%$121/sqft |
Source: CENTURY 21 Desert Rock #506643 Report a problem | ||
| 11/21/2018 | Price change | $312,000+4.3%$124/sqft |
Source: CENTURY 21 Desert Rock #506643 Report a problem | ||
| 11/15/2018 | Listed for sale | $299,000+66.1%$119/sqft |
Source: CENTURY 21 Desert Rock #506643 Report a problem | ||
| 9/17/2018 | Sold | $180,000-18.2%$72/sqft |
Source: | ||
| 8/14/2018 | Pending sale | $220,000$87/sqft |
Source: CENTURY 21 Desert Rock #500696 Report a problem | ||
| 6/8/2018 | Listed for sale | $220,000+241.1%$87/sqft |
Source: CENTURY 21 Desert Rock #500696 Report a problem | ||
| 6/1/2009 | Sold | $64,500-6.5%$26/sqft |
Source: Public Record Report a problem | ||
| 4/26/2009 | Price change | $69,000-12.7%$27/sqft |
Source: Keller Williams Realty #370867 Report a problem | ||
| 4/1/2009 | Listed for sale | $79,000-29.5%$31/sqft |
Source: Keller Williams Realty #370867 Report a problem | ||
| 2/11/2009 | Sold | $112,000+1.8%$45/sqft |
Source: Public Record Report a problem | ||
| 10/23/2008 | Price change | $110,000-45%$44/sqft |
Source: Listhub #Y805416 Report a problem | ||
| 8/23/2008 | Listed for sale | $200,000-16.7%$79/sqft |
Source: Listhub #Y805416 Report a problem | ||
| 4/1/2005 | Sold | $240,000+128.6%$95/sqft |
Source: Public Record Report a problem | ||
| 10/2/2002 | Sold | $105,000$42/sqft |
Source: Public Record Report a problem | ||
Public tax history
Public tax history
| Year | Property taxes | Tax assessment |
|---|---|---|
| 2025 | $4,513 -5.6% | $340,232 +2% |
| 2024 | $4,780 +0.4% | $333,561 +2% |
| 2023 | $4,762 -0.3% | $327,021 +2% |
| 2022 | $4,777 +29.7% | $320,609 +2% |
| 2021 | $3,682 -7.5% | $314,323 +1% |
| 2020 | $3,979 +39.6% | $311,100 +28% |
| 2019 | $2,851 +85.6% | $243,000 +137.6% |
| 2018 | $1,536 +22.4% | $102,277 +2% |
| 2017 | $1,255 | $100,271 +2% |
| 2016 | $1,255 +6.7% | $98,305 +1.5% |
| 2015 | $1,176 +1.5% | $96,828 +2% |
| 2014 | $1,158 | $94,931 +0.5% |
| 2013 | -- | $94,502 +2% |
| 2012 | -- | $92,649 +2% |
| 2011 | -- | $90,832 +41.2% |
| 2010 | -- | $64,347 -75.2% |
| 2009 | -- | $259,782 +2% |
| 2008 | -- | $254,689 +2% |
| 2007 | -- | $249,696 +2% |
| 2006 | -- | $244,800 +124.4% |
| 2005 | -- | $109,100 +2% |
| 2004 | -- | $106,960 +1.9% |
| 2003 | -- | $105,000 -20.4% |
| 2002 | -- | $131,855 +2% |
| 2001 | -- | $129,270 +2% |
| 2000 | -- | $126,736 |
Find assessor info on the county website
Monthly payment
Estimated monthly payment
All calculations are estimates and provided by Zillow, Inc. for informational purposes only. Actual amounts may vary.
HOA fees may include property taxes on listings classified as Co-Ops. Contact the listing agent and/or owner for fee details.
Mortgage interest rates are dependent on a number of factors, including credit score, down payment, and repayment length. Interest rate data provided by Zillow Group Marketplace, Inc. as of 1/1/1970 from various mortgage lenders with which we have lead or other similar arrangements; the Estimated Payment is an average of those rates.
See how much you could borrow to make a competitive offer.
Climate risks
Neighborhood: 92308
Nearby schools
GreatSchools rating
- 1/10Mariana AcademyGrades: K-8Distance: 0.8 mi
- 5/10Apple Valley High SchoolGrades: 9-12Distance: 1.3 mi
- California
- San Bernardino County
- Apple Valley
- 92308
- 10921 Mohawk Rd
Nearby cities
Nearby zip codes
Other Apple Valley Topics
