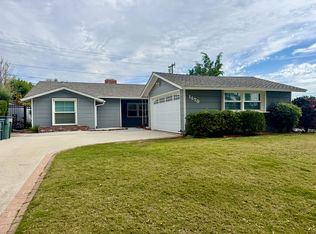
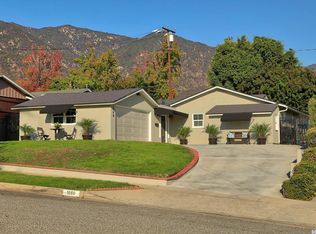
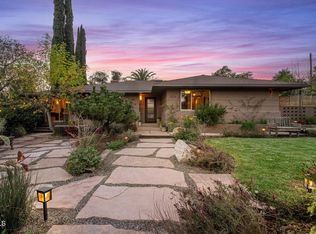
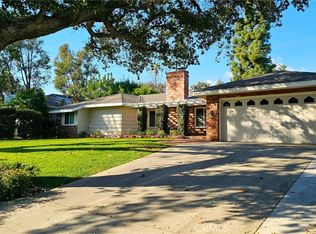
This 2439 square foot single family home has 4 bedrooms and 3.0 bathrooms. This home is located at 1050 Medford Rd, Pasadena, CA 91107.
Pre-foreclosure
Street View
Est. $1,809,200
1050 Medford Rd, Pasadena, CA 91107
4beds
2,439sqft
SingleFamily
Built in 1951
8,480 Square Feet Lot
$1,809,200 Zestimate®
$742/sqft
$-- HOA
Overview
- 32 days |
- 15 |
- 5 |
Facts & features
Interior
Bedrooms & bathrooms
- Bedrooms: 4
- Bathrooms: 3
- Full bathrooms: 3
Heating
- Wall
Features
- Has fireplace: No
Interior area
- Total interior livable area: 2,439 sqft
Property
Parking
- Total spaces: 1
Features
- Exterior features: Stucco
Lot
- Size: 8,480 Square Feet
Details
- Parcel number: 5758012010
Construction
Type & style
- Home type: SingleFamily
- Architectural style: Conventional
Condition
- Year built: 1951
Community & HOA
Location
- Region: Pasadena
Financial & listing details
- Price per square foot: $742/sqft
- Tax assessed value: $1,223,076
- Annual tax amount: $14,454
Visit our professional directory to find a foreclosure specialist in your area that can help with your home search.
Find a foreclosure agentForeclosure details
Estimated market value
$1,809,200
$1.65M - $1.97M
$7,695/mo
Price history
Price history
| Date | Event | Price |
|---|---|---|
| 5/24/2006 | Sold | $895,000+45.5%$367/sqft |
Source: Public Record Report a problem | ||
| 8/15/2003 | Sold | $615,000+57.7%$252/sqft |
Source: Public Record Report a problem | ||
| 8/31/1999 | Sold | $390,000+88%$160/sqft |
Source: Public Record Report a problem | ||
| 10/6/1997 | Sold | $207,500$85/sqft |
Source: Public Record Report a problem | ||
Public tax history
Public tax history
| Year | Property taxes | Tax assessment |
|---|---|---|
| 2025 | $14,454 +5% | $1,223,076 +2% |
| 2024 | $13,761 +0.8% | $1,199,095 +2% |
| 2023 | $13,647 +3.6% | $1,175,585 +2% |
| 2022 | $13,175 +4.3% | $1,152,535 +2% |
| 2021 | $12,636 +4.2% | $1,129,938 +1% |
| 2020 | $12,127 | $1,118,353 +2% |
| 2019 | $12,127 -1.7% | $1,096,425 +2% |
| 2018 | $12,335 | $1,074,927 +2% |
| 2017 | $12,335 +1.1% | $1,053,851 +24.3% |
| 2016 | $12,201 +23.5% | $848,000 |
| 2015 | $9,876 -0.1% | $848,000 |
| 2014 | $9,887 | $848,000 +11.6% |
| 2012 | -- | $760,000 |
| 2011 | -- | $760,000 |
| 2010 | -- | $760,000 -7% |
| 2009 | -- | $817,100 -12.2% |
| 2008 | -- | $931,157 +2% |
| 2007 | -- | $912,900 +42.7% |
| 2006 | -- | $639,845 |
| 2005 | -- | $639,845 +4% |
| 2004 | -- | $615,000 +48.6% |
| 2003 | -- | $413,869 +2% |
| 2002 | -- | $405,755 +4% |
| 2000 | -- | $390,000 |
Find assessor info on the county website
BuyAbility℠ payment
Estimated monthly payment
Boost your down payment with 6% savings match
Earn up to a 6% match & get a competitive APY with a *. Zillow has partnered with to help get you home faster.
Learn more*Terms apply. Match provided by Foyer. Account offered by Pacific West Bank, Member FDIC.Climate risks
Neighborhood: North East
Nearby schools
GreatSchools rating
- 6/10Don Benito Fundamental SchoolGrades: K-5Distance: 0.4 mi
- 7/10Cis AcademyGrades: K-12Distance: 1.3 mi
- 8/10Pasadena High SchoolGrades: 9-12Distance: 1.3 mi
Open to renting?
Browse rentals near this home.