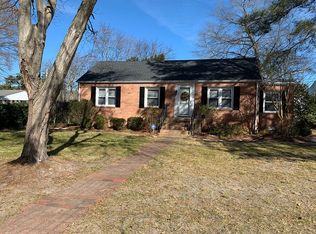
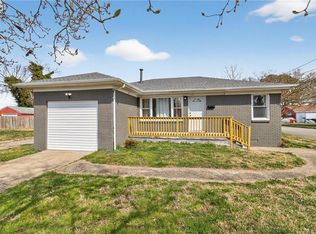
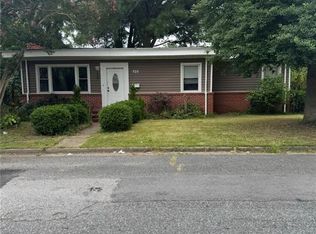
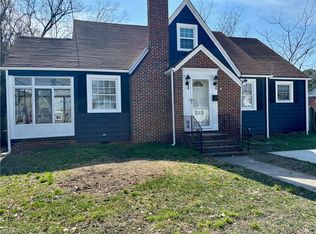
This STUNNING Brick Ranch checks the box on Price, Bedrooms, & STYLE. You'll love the Gorgeous Kitchen & Bathrooms with Open Floor Plan & Back Deck perfect for entertaining. The Converted Garage provides an additional room off of the living room that can be used as 4th Bedroom or the Perfect Home Office. Tons of storage with a Spacious Utility Room & Two Sheds. Fully Renovated in 2017 with New Roof, HVAC, Electrical, Flooring, & Windows, it's perfect for Low Maintenance Living. Sought-after Waterview is a quiet neighborhood with Treelined Streets & an active Civic League Community. Centrally Located & Quick Commute to all Portsmouth Military Bases. Five Minutes to a City Park with Public Boat Ramps, Fishing Pier, Skate Park, & a Playground that kids will love!
Foreclosed
Est. $328,100
103 Rockbridge Rd, Portsmouth, VA 23707
4beds
1,600sqft
SingleFamily
Built in 1979
6,969 Square Feet Lot
$328,100 Zestimate®
$205/sqft
$-- HOA
Overview
- 152 days |
- 25 |
- 0 |
Facts & features
Interior
Bedrooms & bathrooms
- Bedrooms: 4
- Bathrooms: 2
- Full bathrooms: 2
Heating
- Heat pump, Electric
Cooling
- Central
Appliances
- Included: Dishwasher, Garbage disposal, Microwave, Range / Oven, Refrigerator
Features
- Window Treatments
- Flooring: Tile, Carpet, Laminate
Interior area
- Total interior livable area: 1,600 sqft
Property
Parking
- Parking features: Carport, On-street
Features
- Exterior features: Brick
- Has view: Yes
- View description: Water
- Has water view: Yes
- Water view: Water
Lot
- Size: 6,969 Square Feet
Details
- Parcel number: 03560390
Construction
Type & style
- Home type: SingleFamily
Materials
- brick
- Roof: Asphalt
Condition
- Year built: 1979
Community & HOA
Location
- Region: Portsmouth
Financial & listing details
- Price per square foot: $205/sqft
- Tax assessed value: $261,760
- Annual tax amount: $3,220
- Ownership type: Simple
Visit our professional directory to find a foreclosure specialist in your area that can help with your home search.
Find a foreclosure agentForeclosure details
Estimated market value
$328,100
$308,000 - $345,000
$2,035/mo
Price history
Price history
| Date | Event | Price |
|---|---|---|
| 10/14/2025 | Sold | $210,125-18.2%$131/sqft |
Source: Public Record Report a problem | ||
| 3/7/2022 | Sold | $257,000+2.8%$161/sqft |
Source: Public Record Report a problem | ||
| 2/15/2022 | Pending sale | $249,900$156/sqft |
Source: Rose and Womble Realty Company #10416093 Report a problem | ||
| 2/15/2022 | Contingent | $249,900$156/sqft |
Source: | ||
| 2/4/2022 | Listed for sale | $249,900$156/sqft |
Source: | ||
| 1/13/2022 | Pending sale | $249,900$156/sqft |
Source: Rose and Womble Realty Company #10416093 Report a problem | ||
| 1/13/2022 | Contingent | $249,900$156/sqft |
Source: | ||
| 12/22/2021 | Listed for sale | $249,900$156/sqft |
Source: | ||
| 11/24/2021 | Pending sale | $249,900$156/sqft |
Source: Rose and Womble Realty Company #10408555 Report a problem | ||
| 11/23/2021 | Contingent | $249,900$156/sqft |
Source: | ||
| 11/10/2021 | Price change | $249,900-5.7%$156/sqft |
Source: | ||
| 11/5/2021 | Price change | $264,990-1.9%$166/sqft |
Source: | ||
| 10/28/2021 | Listed for sale | $269,990+3.8%$169/sqft |
Source: | ||
| 10/27/2021 | Listing removed | $259,990$162/sqft |
Source: | ||
| 10/12/2021 | Listed for sale | $259,990+38.4%$162/sqft |
Source: | ||
| 6/24/2019 | Listing removed | $187,900$117/sqft |
Source: Harbor Associates Real Estate #10259268 Report a problem | ||
| 5/29/2019 | Price change | $187,900-0.8%$117/sqft |
Source: Harbor Associates Real Estate #10259268 Report a problem | ||
| 5/20/2019 | Price change | $189,500-2.8%$118/sqft |
Source: Harbor Associates Real Estate #10259268 Report a problem | ||
| 4/15/2019 | Listed for sale | $195,000-1.3%$122/sqft |
Source: Century Realty #10252789 Report a problem | ||
| 7/18/2017 | Listing removed | $197,500$123/sqft |
Source: EXIT REALTY PROFESSIONALS #10122652 Report a problem | ||
| 7/17/2017 | Listed for sale | $197,500+14.2%$123/sqft |
Source: EXIT REALTY PROFESSIONALS #10122652 Report a problem | ||
| 7/7/2017 | Sold | $173,000-3.8%$108/sqft |
Source: Public Record Report a problem | ||
| 6/29/2017 | Pending sale | $179,800$112/sqft |
Source: Exit Realty Professionals #10122652 Report a problem | ||
| 6/23/2017 | Listed for sale | $179,800$112/sqft |
Source: EXIT REALTY PROFESSIONALS #10122652 Report a problem | ||
| 6/23/2017 | Pending sale | $179,800$112/sqft |
Source: Exit Realty Professionals #10122652 Report a problem | ||
| 6/1/2017 | Price change | $179,800-0.1%$112/sqft |
Source: Exit Realty Professionals #10122652 Report a problem | ||
| 5/24/2017 | Listed for sale | $179,900+89.4%$112/sqft |
Source: Exit Realty Professionals #10122652 Report a problem | ||
| 9/23/2016 | Sold | $95,000-5.5%$59/sqft |
Source: Public Record Report a problem | ||
| 3/14/2016 | Sold | $100,580$63/sqft |
Source: Public Record Report a problem | ||
Public tax history
Public tax history
| Year | Property taxes | Tax assessment |
|---|---|---|
| 2024 | $3,220 +3.6% | $261,760 +5.3% |
| 2023 | $3,108 +6.5% | $248,650 +10.8% |
| 2022 | $2,918 +5.5% | $224,480 +5.5% |
| 2021 | $2,767 +2.8% | $212,830 +2.8% |
| 2019 | $2,690 | $206,940 |
| 2018 | $2,690 | $206,940 |
| 2017 | $2,690 +0.4% | $206,940 +3.8% |
| 2016 | $2,678 +3.4% | $199,280 |
| 2015 | $2,591 +2.4% | $199,280 |
| 2014 | $2,531 | $199,280 |
| 2013 | $2,531 | $199,280 |
| 2012 | $2,531 -2.1% | $199,280 -2.1% |
| 2011 | $2,585 +2.4% | $203,550 |
| 2010 | $2,524 -6.5% | $203,550 -6.5% |
| 2009 | $2,700 +2.5% | $217,770 |
| 2008 | $2,635 +1.8% | $217,770 +6% |
| 2007 | $2,588 +7.7% | $205,420 +16.3% |
| 2006 | $2,402 +33.4% | $176,640 +41.2% |
| 2005 | $1,801 +12.8% | $125,090 +13.6% |
| 2004 | $1,597 +15% | $110,110 +12.6% |
| 2003 | $1,388 +4.9% | $97,770 +4.9% |
| 2002 | $1,323 +4.3% | $93,160 +4.3% |
| 2001 | $1,268 | $89,330 |
Find assessor info on the county website
BuyAbility℠ payment
Estimated monthly payment
Boost your down payment with 6% savings match
Earn up to a 6% match & get a competitive APY with a *. Zillow has partnered with to help get you home faster.
Learn more*Terms apply. Match provided by Foyer. Account offered by Pacific West Bank, Member FDIC.Climate risks
Neighborhood: Waterview
Nearby schools
GreatSchools rating
- 2/10John Tyler Elementary SchoolGrades: K-6Distance: 0.5 mi
- 5/10Churchland Middle SchoolGrades: 7-8Distance: 3.6 mi
- 5/10Churchland High SchoolGrades: 9-12Distance: 3.4 mi
Schools provided by the listing agent
- Elementary: John Tyler Elementary
- Middle: Churchland Middle
- High: Churchland
Source: The MLS. This data may not be complete. We recommend contacting the local school district to confirm school assignments for this home.