$710,700
4 bd|3 ba|4.2k sqft
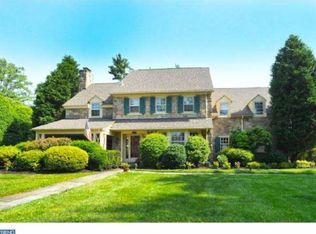
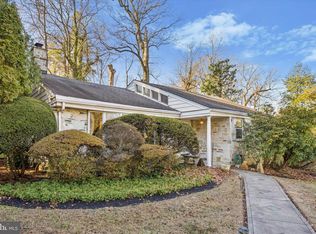
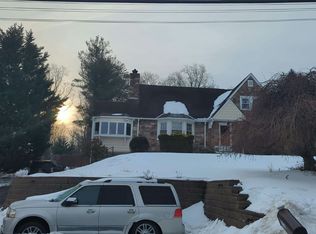
1815 Canterbury Rd, Abington, PA 19001
Off Market
Zillow last checked: 8 hours ago
Listing updated: February 14, 2026 at 07:35am
Michael Choe 215-740-1255,
New Investment Realty 215-740-1255
$590,900
$561,000 - $620,000
$3,960/mo
| Date | Event | Price |
|---|---|---|
| 2/14/2026 | Contingent | $600,000$151/sqft |
Source: | ||
| 1/8/2026 | Listed for sale | $600,000$151/sqft |
Source: | ||
| 10/20/2025 | Listing removed | $600,000$151/sqft |
Source: | ||
| 9/8/2025 | Price change | $600,000+5.3%$151/sqft |
Source: | ||
| 7/10/2025 | Listed for sale | $570,000-2.6%$143/sqft |
Source: | ||
| 5/3/2025 | Listing removed | $585,000$147/sqft |
Source: | ||
| 4/28/2025 | Price change | $585,000-7.1%$147/sqft |
Source: | ||
| 1/19/2025 | Price change | $630,000-3.1%$158/sqft |
Source: | ||
| 1/9/2025 | Listed for sale | $650,000$164/sqft |
Source: | ||
| 12/3/2024 | Listing removed | $650,000$164/sqft |
Source: | ||
| 12/2/2024 | Listed for sale | $650,000$164/sqft |
Source: | ||
| 6/29/2024 | Listing removed | -- |
Source: | ||
| 4/17/2024 | Price change | $650,000-7.8%$164/sqft |
Source: | ||
| 3/15/2024 | Price change | $705,000-2.8%$177/sqft |
Source: | ||
| 3/11/2024 | Price change | $725,000-3.3%$182/sqft |
Source: | ||
| 2/24/2024 | Price change | $750,000-6.3%$189/sqft |
Source: | ||
| 2/5/2024 | Listed for sale | $800,000+105.1%$201/sqft |
Source: | ||
| 2/11/2013 | Sold | $390,000-21.2%$98/sqft |
Source: Public Record Report a problem | ||
| 4/14/2012 | Price change | $495,000-10%$125/sqft |
Source: RE/MAX ACTION REALTY #5830589 Report a problem | ||
| 1/31/2011 | Price change | $550,000+10%$138/sqft |
Source: RE/MAX Action Realty #5830589 Report a problem | ||
| 1/24/2010 | Listed for sale | $499,900$126/sqft |
Source: RE/MAX Action Realty #5648266 Report a problem | ||
| Year | Property taxes | Tax assessment |
|---|---|---|
| 2025 | $11,336 +5.3% | $235,330 |
| 2024 | $10,769 | $235,330 |
| 2023 | $10,769 +6.5% | $235,330 |
| 2022 | $10,109 +5.7% | $235,330 |
| 2021 | $9,565 +0.4% | $235,330 |
| 2020 | $9,524 +1% | $235,330 |
| 2019 | $9,428 +0.6% | $235,330 |
| 2018 | $9,371 +3.5% | $235,330 |
| 2017 | $9,058 +3.1% | $235,330 |
| 2016 | $8,783 +3.1% | $235,330 |
| 2015 | $8,516 +3.6% | $235,330 |
| 2014 | $8,219 +0.2% | $235,330 |
| 2013 | $8,206 +0.6% | $235,330 |
| 2012 | $8,160 +1.3% | $235,330 |
| 2011 | $8,052 +2.4% | $235,330 |
| 2010 | $7,865 -0.5% | $235,330 |
| 2009 | $7,902 +2% | $235,330 |
| 2008 | $7,744 +3.6% | -- |
| 2007 | $7,476 +5.7% | -- |
| 2006 | $7,073 +5.1% | -- |
| 2005 | $6,732 +6.8% | -- |
| 2004 | $6,301 +0.7% | -- |
| 2003 | $6,257 +3.3% | -- |
| 2002 | $6,060 +7.4% | -- |
| 2000 | $5,643 +4.7% | -- |
| 1999 | $5,389 | -- |
Find assessor info on the county website
Source: Bright MLS. This data may not be complete. We recommend contacting the local school district to confirm school assignments for this home.