$441,500
-- bd|-- ba|1.6k sqft
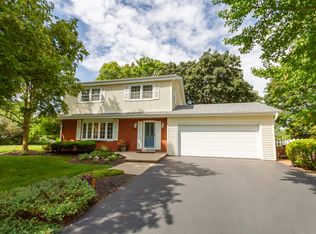
0N310 Robbins St, Winfield, IL 60190
Off Market
Zillow last checked: 7 hours ago
Listing updated: February 27, 2026 at 01:31am
Kathleen Daniels 847-946-6329,
@properties Christies International Real Estate
Not available
Estimated sales range
Not available
Not available
| Date | Event | Price |
|---|---|---|
| 10/12/2025 | Listing removed | $500,000$249/sqft |
Source: | ||
| 10/8/2025 | Listed for sale | $500,000+19%$249/sqft |
Source: | ||
| 12/7/2022 | Sold | $420,000$209/sqft |
Source: | ||
| 9/27/2022 | Contingent | $420,000$209/sqft |
Source: | ||
| 9/13/2022 | Price change | $420,000-1.2%$209/sqft |
Source: | ||
| 9/1/2022 | Listed for sale | $425,000-1.1%$211/sqft |
Source: | ||
| 8/26/2022 | Listing removed | $429,900$214/sqft |
Source: | ||
| 7/18/2022 | Contingent | $429,900$214/sqft |
Source: | ||
| 7/13/2022 | Price change | $429,900-2.3%$214/sqft |
Source: | ||
| 7/1/2022 | Listed for sale | $439,900+43.3%$219/sqft |
Source: | ||
| 9/20/2016 | Sold | $307,000-3.9%$153/sqft |
Source: | ||
| 8/11/2016 | Pending sale | $319,500$159/sqft |
Source: Coldwell Banker Residential Brokerage - Hinsdale Village #09293264 Report a problem | ||
| 7/21/2016 | Listed for sale | $319,500$159/sqft |
Source: Coldwell Banker Residential Brokerage - Hinsdale Village #09293264 Report a problem | ||
| Year | Property taxes | Tax assessment |
|---|---|---|
| 2024 | $9,615 +4.6% | $136,097 +9.5% |
| 2023 | $9,190 +6.4% | $124,300 +7.5% |
| 2022 | $8,640 +6.3% | $115,640 +4.3% |
| 2021 | $8,129 +1.8% | $110,850 +3.1% |
| 2020 | $7,987 +0.8% | $107,480 +5% |
| 2019 | $7,927 +4.5% | $102,350 +6% |
| 2018 | $7,585 +2.6% | $96,580 +5.2% |
| 2017 | $7,390 +2.8% | $91,770 +7.3% |
| 2016 | $7,187 +15.8% | $85,560 +8% |
| 2015 | $6,207 -2.5% | $79,200 +5% |
| 2014 | $6,369 +1.2% | $75,420 -3.5% |
| 2013 | $6,291 +0% | $78,180 -7.9% |
| 2012 | $6,289 +0.7% | $84,870 -9.5% |
| 2011 | $6,242 +8.7% | $93,790 -7.3% |
| 2010 | $5,740 +7.9% | $101,130 -4.4% |
| 2009 | $5,322 +1% | $105,770 |
| 2008 | $5,269 -2.5% | $105,770 +7.2% |
| 2007 | $5,404 -5.5% | $98,660 +4.9% |
| 2006 | $5,721 +2.4% | $94,080 +6.5% |
| 2005 | $5,585 +1.9% | $88,340 +2.7% |
| 2004 | $5,482 +2.7% | $86,030 +7% |
| 2003 | $5,337 +5.4% | $80,400 +10% |
| 2002 | $5,065 +12.2% | $73,100 +7.5% |
| 2001 | $4,514 +2.4% | $68,010 +5.3% |
| 2000 | $4,410 | $64,590 |
Find assessor info on the county website
Source: MRED as distributed by MLS GRID. This data may not be complete. We recommend contacting the local school district to confirm school assignments for this home.