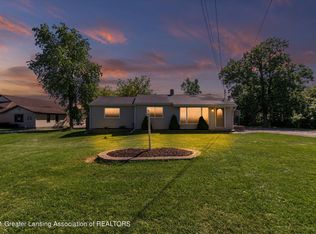
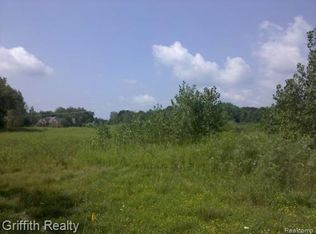
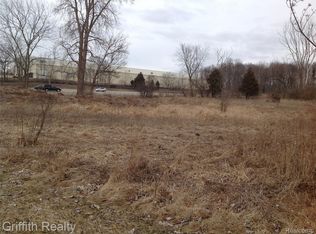
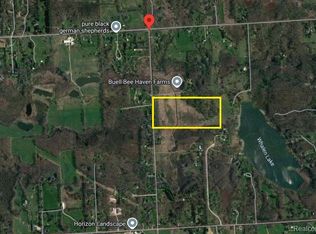
19.75 Acres perfect for Industrial and Warehouse Distribution. Current Zoning is Industrial Flex. Important to know the location is next door to the Kensington Outlet Mall with visitors locally and far distances, averaging more than 3.5 million visitors per year. The site is located 1 mile west of Downtown Howell. This is a heavily traveled connector route from I-96 to Grand River, class A all-weather state road. No wetlands or environmental issues. All utilities in place. Concept plan put together for self storage. Broker Owned.
Lot/land
$1,399,000
0 N Burkhart Rd, Howell, MI 48855
--beds
--baths
19.75Acres
Land
Built in ----
19.75 Acres Lot
$-- Zestimate®
$--/sqft
$-- HOA
What's special
All utilities in placeHeavily traveled connector route
- 219 days |
- 39 |
- 0 |
Zillow last checked: 7 hours ago
Listing updated: October 15, 2025 at 07:55am
Listed by:
Steve J Gronow 810-599-5147,
Chestnut Real Estate 888-825-1420
Source: Realcomp II,MLS#: 20251023518
Facts & features
Interior
Features
- Has basement: No
- Has fireplace: No
Property
Lot
- Size: 19.75 Acres
- Dimensions: 840 x 600 x 1227 x 1477
Details
- Parcel number: 0629200029
- Zoning description: Commercial, HeavyIndustry, LightIndustry
- Special conditions: Short Sale No,Standard
Utilities & green energy
- Sewer: Sewer At Street
- Water: Waterat Street
Community & HOA
Location
- Region: Howell
Financial & listing details
- Tax assessed value: $240,119
- Annual tax amount: $5,637
- Date on market: 8/11/2025
- Cumulative days on market: 483 days
- Listing agreement: Exclusive Right To Sell
- Listing terms: Cash,Conventional
Estimated market value
Not available
Estimated sales range
Not available
$1,481/mo
Price history
Price history
| Date | Event | Price |
|---|---|---|
| 8/11/2025 | Listed for sale | $1,399,000+11092% |
Source: | ||
| 5/30/2024 | Sold | $12,500-37.5% |
Source: | ||
| 5/30/2024 | Pending sale | $20,000 |
Source: | ||
| 5/7/2024 | Listed for sale | $20,000 |
Source: | ||
| 4/10/2024 | Pending sale | $20,000 |
Source: | ||
| 4/4/2024 | Listed for sale | $20,000-66.7% |
Source: | ||
| 1/3/2024 | Listing removed | -- |
Source: | ||
| 8/17/2023 | Pending sale | $60,000 |
Source: | ||
| 8/8/2023 | Listed for sale | $60,000-95% |
Source: | ||
| 6/3/2023 | Listing removed | -- |
Source: | ||
| 10/21/2021 | Price change | $1,200,000+71.4% |
Source: | ||
| 8/10/2021 | Price change | $700,000+84.3% |
Source: | ||
| 5/26/2021 | Pending sale | $379,900+279.9% |
Source: | ||
| 3/15/2021 | Price change | $100,000-73.7% |
Source: | ||
| 1/7/2021 | Price change | $379,900-2.6% |
Source: | ||
| 11/9/2020 | Price change | $390,000-18.8% |
Source: Preview Properties PC #2200071666 Report a problem | ||
| 9/1/2020 | Listed for sale | $480,000+380.5% |
Source: Preview Properties PC #2200071666 Report a problem | ||
| 7/10/2019 | Listing removed | $99,900 |
Source: Owner Report a problem | ||
| 7/2/2019 | Listed for sale | $99,900 |
Source: Owner Report a problem | ||
Public tax history
Public tax history
| Year | Property taxes | Tax assessment |
|---|---|---|
| 2025 | $981 +7% | $62,160 +12% |
| 2024 | $917 +7.8% | $55,500 +25% |
| 2023 | $850 +2.6% | $44,400 |
| 2022 | $829 | $44,400 |
| 2021 | -- | $44,400 +11% |
| 2020 | -- | $40,000 +6.1% |
| 2019 | $835 +181.5% | $37,700 -5.8% |
| 2018 | $297 | $40,000 +6.1% |
| 2017 | -- | $37,700 +13.2% |
| 2016 | -- | $33,300 |
| 2014 | -- | $33,300 |
| 2012 | $797 | $33,300 |
| 2011 | -- | $33,300 -15.7% |
| 2010 | -- | $39,500 -10.1% |
| 2009 | -- | $43,956 |
| 2008 | -- | $43,956 |
| 2007 | $418 +12.6% | -- |
| 2006 | $371 | $29,517 |
Find assessor info on the county website
BuyAbility℠ payment
Estimated monthly payment
All calculations are estimates and provided by Zillow, Inc. for informational purposes only. Actual amounts may vary.
HOA fees may include property taxes on listings classified as Co-Ops. Contact the listing agent and/or owner for fee details.
Mortgage interest rates are dependent on a number of factors, including credit score, down payment, and repayment length. Interest rate data provided by Zillow Group Marketplace, Inc. as of 1/1/1970 from various mortgage lenders with which we have lead or other similar arrangements; the Estimated Payment is an average of those rates.
See how much you could borrow to make a competitive offer.
Boost your down payment with 6% savings match
Earn up to a 6% match & get a competitive APY with a *. Zillow has partnered with to help get you home faster.
Learn more*Terms apply. Match provided by Foyer. Account offered by Pacific West Bank, Member FDIC.Climate risks
Neighborhood: 48855
Nearby schools
GreatSchools rating
- 5/10Challenger Elementary SchoolGrades: K-5Distance: 2.8 mi
- 6/10Highlander Way Middle SchoolGrades: 6-8Distance: 2.3 mi
- 8/10Howell High SchoolGrades: 9-12Distance: 2.6 mi
Local experts in 48855


- Michigan
- Livingston County
- Howell
- 48855
- 0 N Burkhart Rd
Nearby cities
Nearby zip codes
Other Howell Topics
