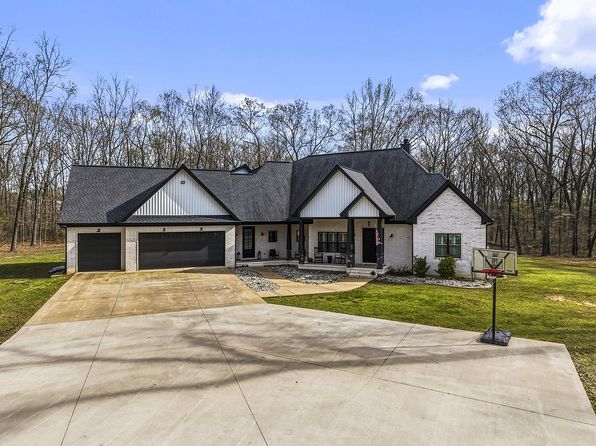
Skip main navigation

Cabot, AR Housing Market

$243,134

3.3% 1-yr

The average Cabot, AR home value is $243,134, up 3.3% over the past year and goes to pending in around 66 days.

What is the Zillow Home Values Index?

Zillow Home Value Index (ZHVI), built from the ground up by measuring monthly changes in property level Zestimates, captures both the level and home values across a wide variety of geographies and housing types.

Learn more about the Zillow Home Value Index

Cabot Key Takeaways

Typical Home Values: $243,134

1-year Value Change: +3.3%

(Data through March 31, 2025)

Cabot Housing Market Overview

--1-year Market Forecast
235For sale inventory(March 31, 2025)
54New listings(March 31, 2025)
--Median sale to list ratio
$217,983Median sale price(February 28, 2025)
$260,000Median list price(March 31, 2025)
--Percent of sales over list price
--Percent of sales under list price
66Median days to pending(March 31, 2025)
(Metric availability is based on market coverage and data)
How does this data help me?
Zillow's metrics provide valuable market data by tracking market changes in different locations and housing types.

Neighborhoods in Cabot

Move forward with a local partner

Zillow is more than a place to browse homes. It’s a place to connect with a local agent, explore financing solutions, schedule home tours, understand your buying and selling power, and more.

Get pre-qualified for a loan
At Zillow Home Loans, we can pre-qualify you in as little as 5 minutes with no impact on your credit score.
An equal housing lender. NMLS #10287.

Cabot Rental Market Trends

$1,410Average rent in Cabot(March 31, 2025)
$2,005National average rent(March 31, 2025)
1.8%Month-over-month change(March 31, 2025)
3.1%Year-over-year change(March 31, 2025)
How does this data help me?
The Zillow Observed Rent Index (ZORI) measures changes in asking rents over time, controlling for changes in the quality of the available rental inventory.

More on Zillow Research